Bitcoin Market Structure 101, with weekly time frame analysis
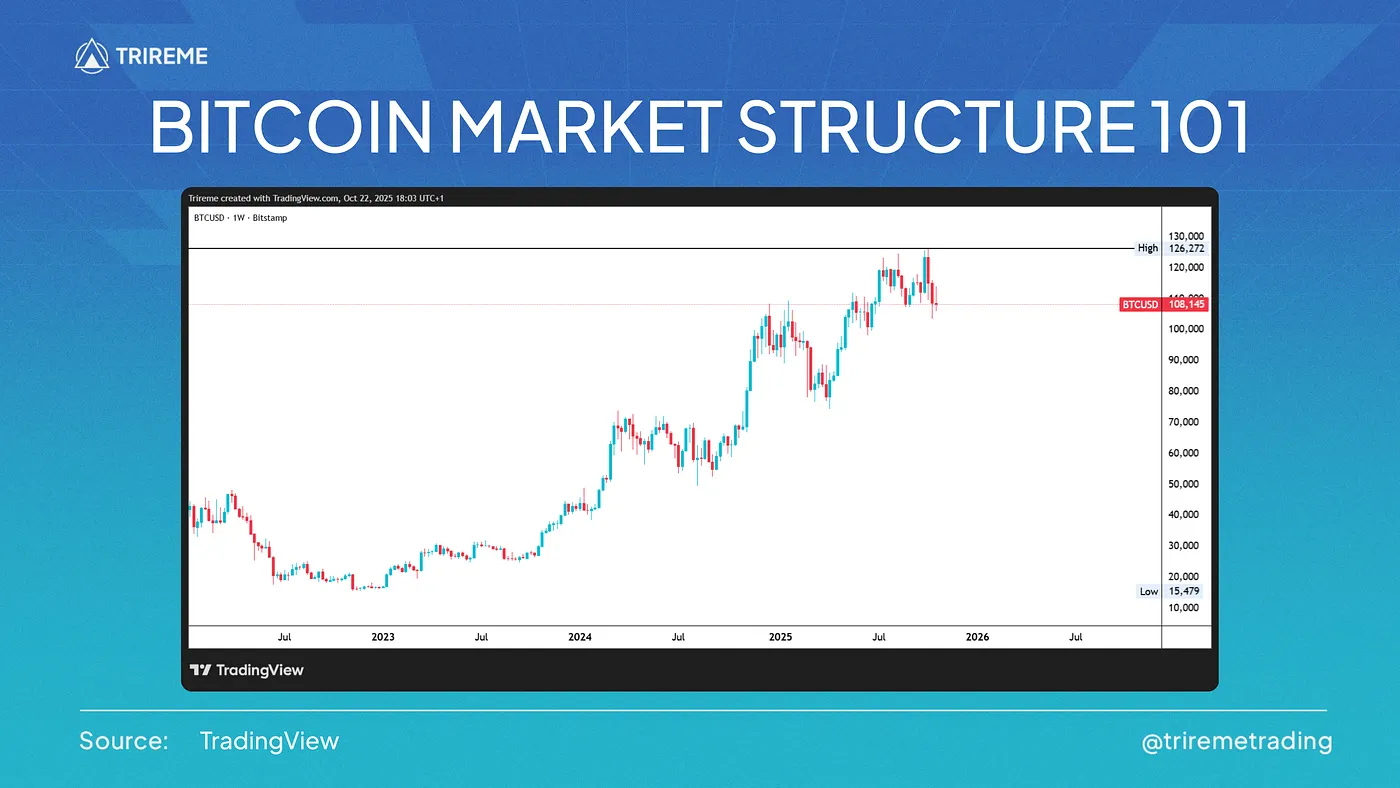
Before diving into the weekly chart, remember the three foundations of market structure:
1️⃣ Trend: Identify if the market is creating higher highs/lows (bullish) or lower highs/lows (bearish).
2️⃣ Structure Breaks: BOS confirms continuation; CHoCH hints at reversal.
A Break of Structure (BOS) confirms continuation of the trend.
A Change of Character (CHoCH) signals potential reversal.
3️⃣ Key Levels: Support, resistance, and liquidity zones define reaction points for traders.
$BTC Weekly time frame analysis:
1. Structure overview:
$BTC remains in a macro uptrend from its 2022–2023 lows, but the weekly chart now shows range-bound price action between $100K–$126K after failing to hold momentum above resistance.
• Higher Lows: The market still respects the $95K–$100K zone as its structural base.
• Lower Highs: Rejections near $125K–$126K have formed a temporary ceiling.
• Overall Structure: Ranging within a bullish macro context — consolidation before potential continuation.
2. Key Swing Points
• Major High: $126K
• Intermediate High: $114K
• Major Support: $100K–$102K
• Reversal Zone: $96K liquidity pool (below prior swing lows).
3. Momentum and Market Context:
• The current weekly candles show indecision, with sellers defending $114K–$120K.
• Market participants are waiting for clarity from upcoming catalysts: CPI print, expected rate cuts, and the Trump–Xi meeting.
• Exchange netflows suggest traders are rotating profits while whales continue to accumulate on spot dips.
4. What to Watch Next
A break above $114K could trigger momentum back toward $125K–$130K.
A close below $100K may confirm short-term bearish continuation, revisiting prior demand zones.