Robinhood Chain Market Intelligence: Launch Data, Token Survival and Trading Patterns
Independent analysis.
This report is not affiliated with, sponsored by, or endorsed by Robinhood, Robinhood Chain, or any protocol referenced in it unless expressly stated. It is provided for informational purposes only and does not constitute financial, legal, investment, or tax advice, nor a recommendation to buy, sell, or hold any asset. See the full notice at the end of this document.
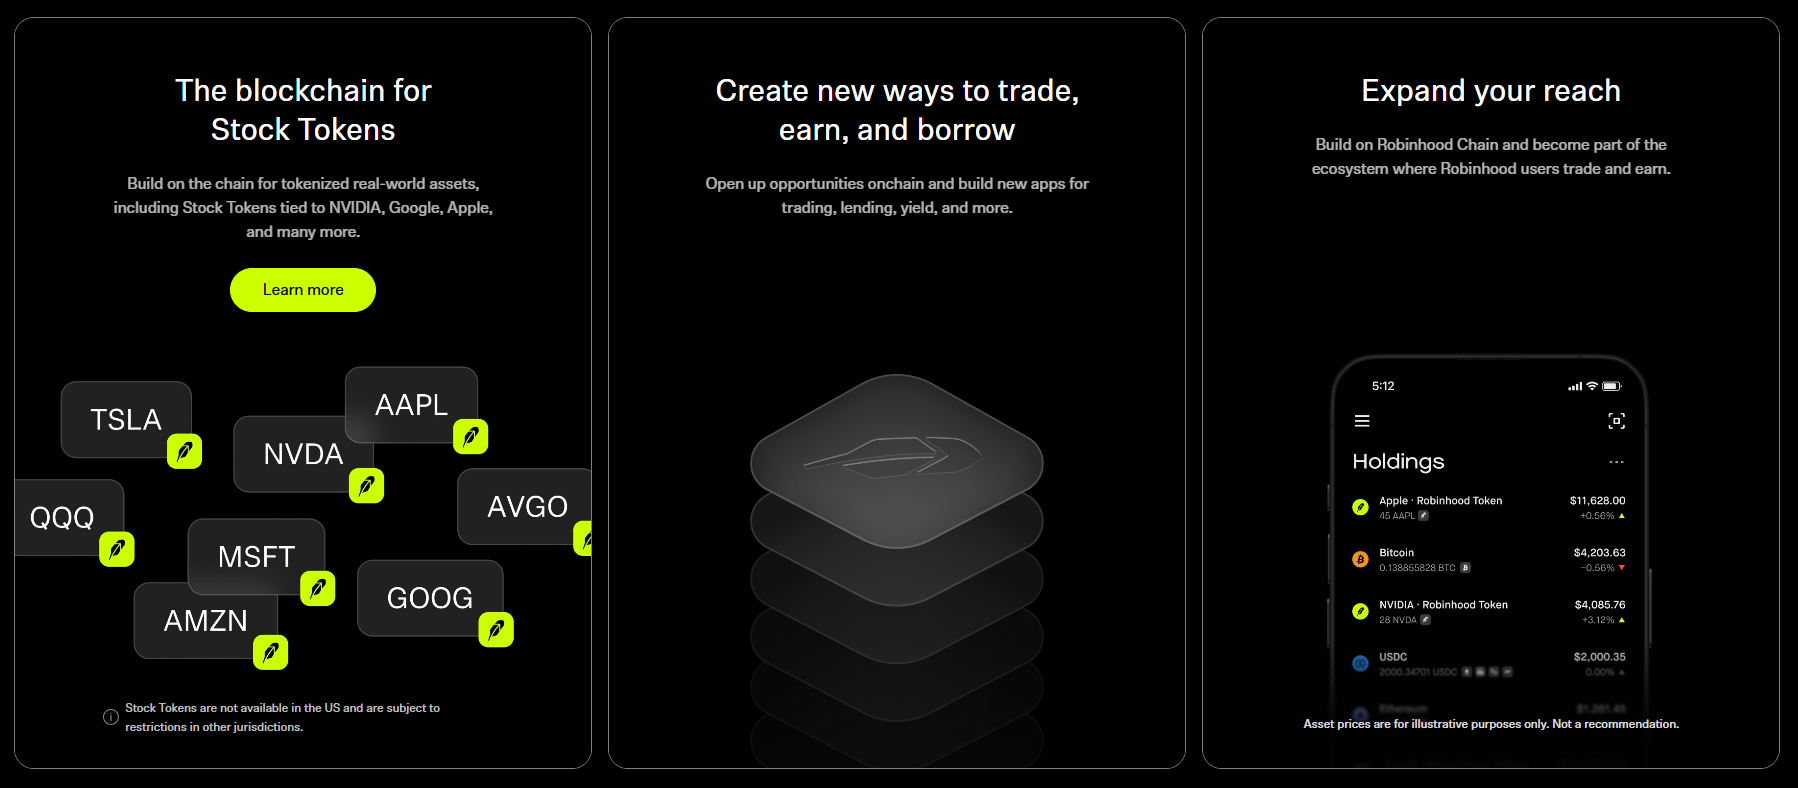
Since the initial launch-week snapshot, Robinhood Chain has expanded meaningfully: tokenized Stock Tokens (NVDA, GOOG, AAPL, GameStop, SpaceX, and others) are now available to eligible users through Robinhood Wallet in more than 120 countries. They are not available in the United States or to US persons, and additional jurisdictional restrictions apply.
The ecosystem also now includes Robinhood Earn (Morpho-based USDG lending, an estimated 7% APY product being rolled out to eligible US users), perpetual futures via Lighter, and early agentic trading accounts.
Source: Robinhood Global Expansion
New infrastructure partners include Chainlink, Alchemy, BitGo, and more.
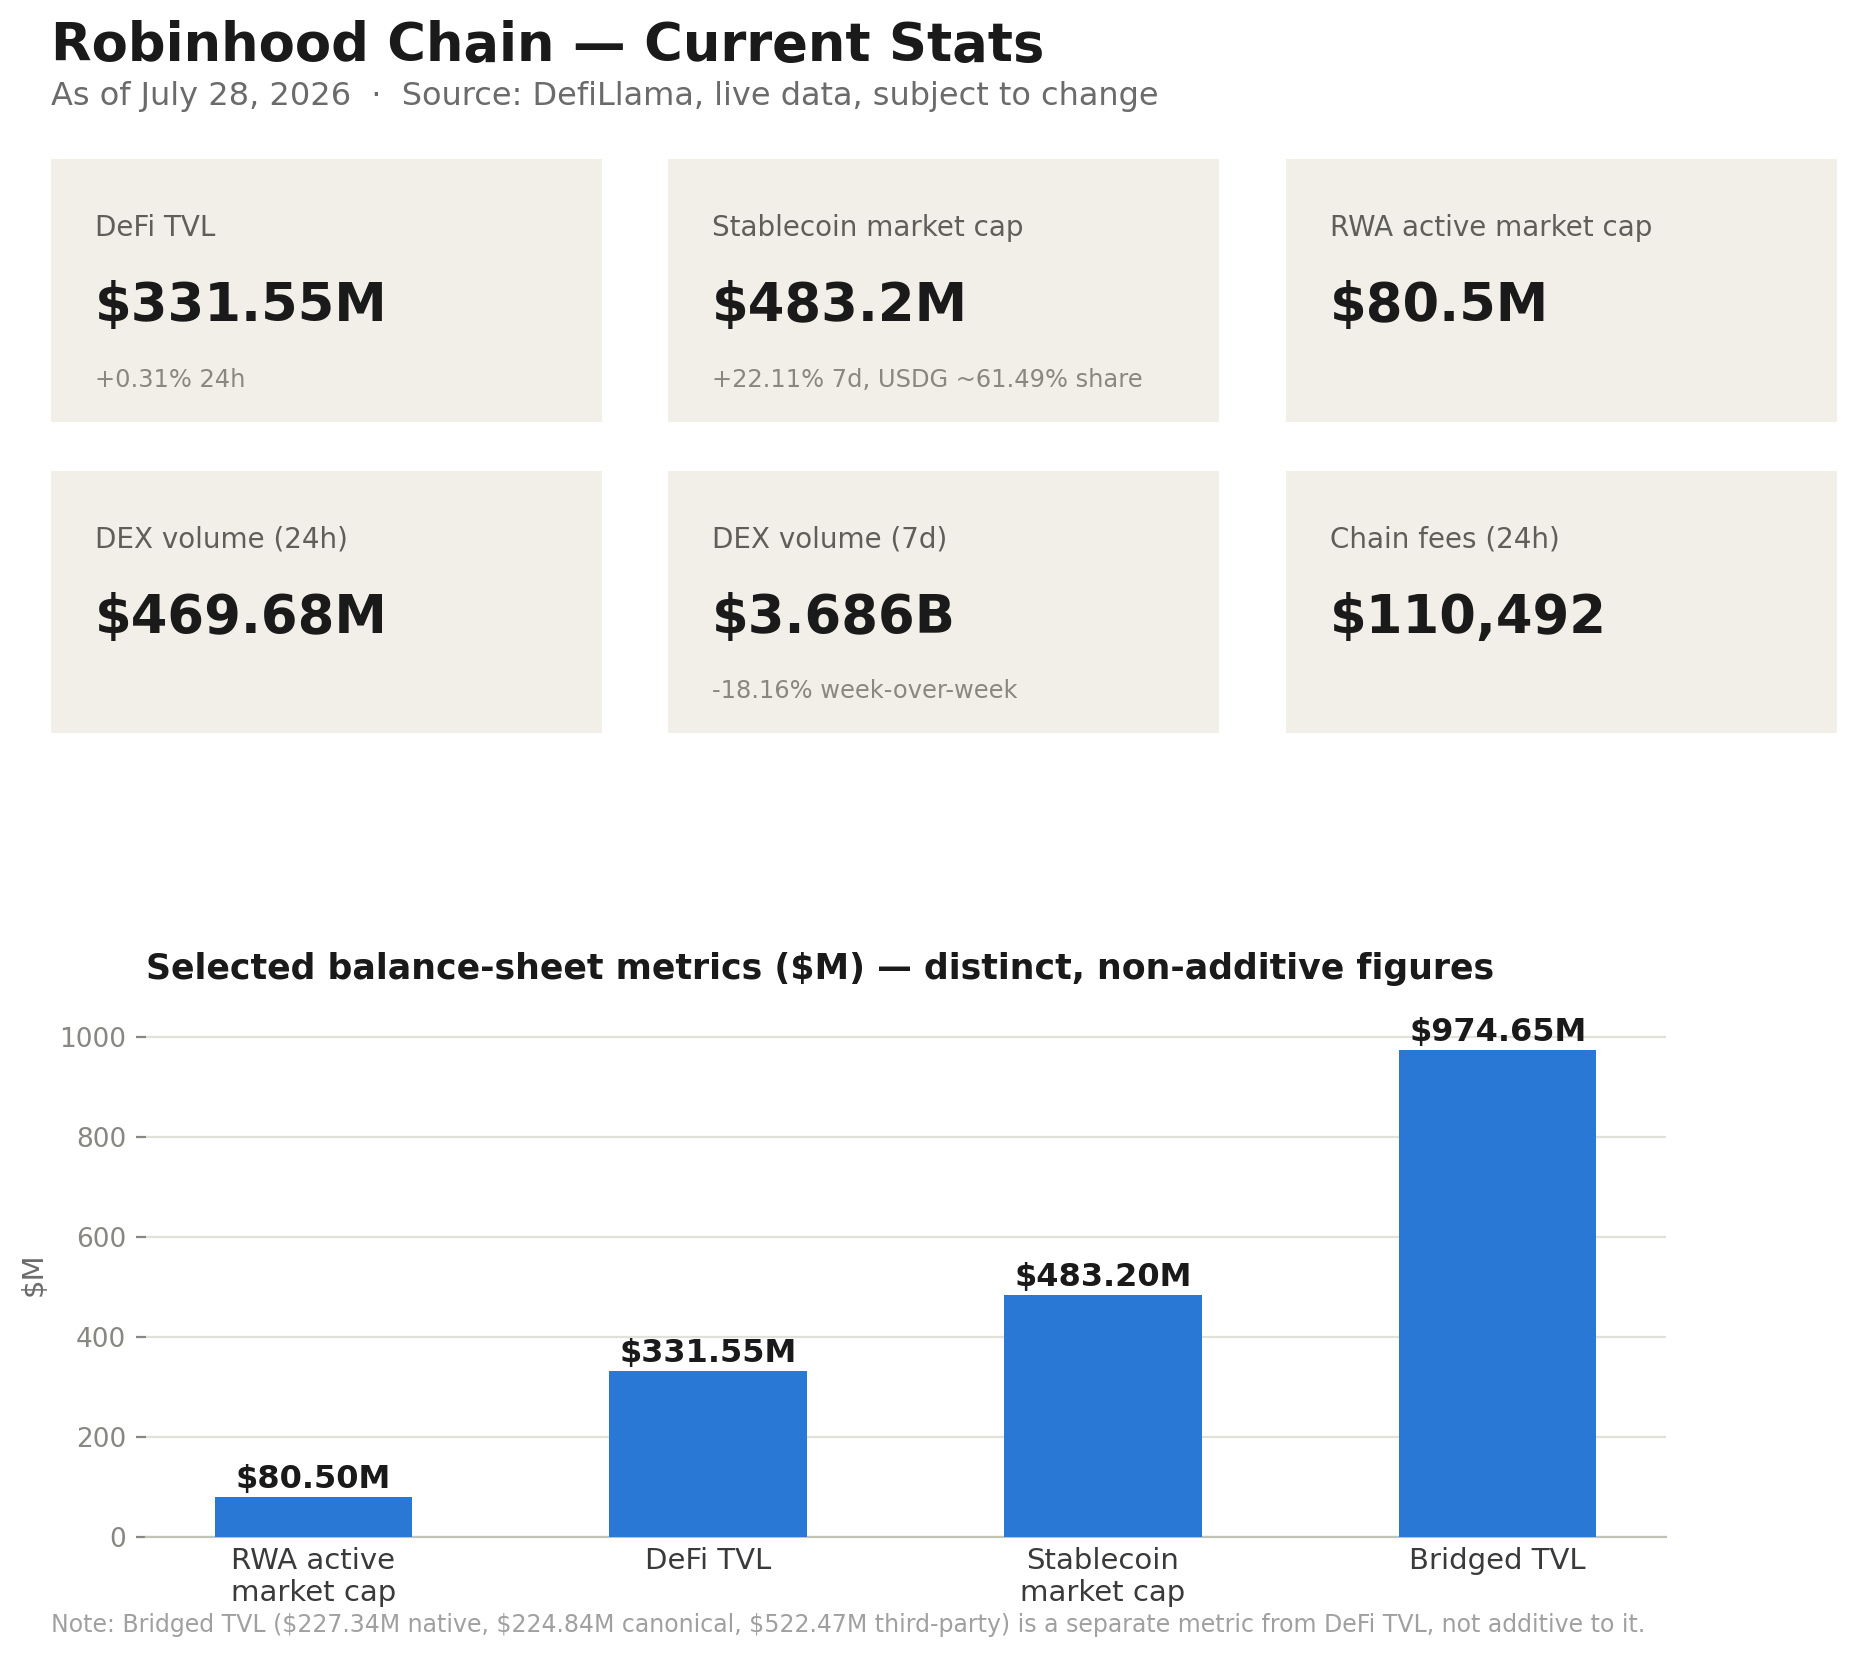
As of 28 July 2026, DefiLlama reported approximately $334.7 million in DeFi TVL and $81.1 million in active RWA market cap on Robinhood Chain. Separately, the Dune dashboard reviewed for this report (see Sources and Methodology) showed approximately $14 billion in cumulative DEX volume since launch.
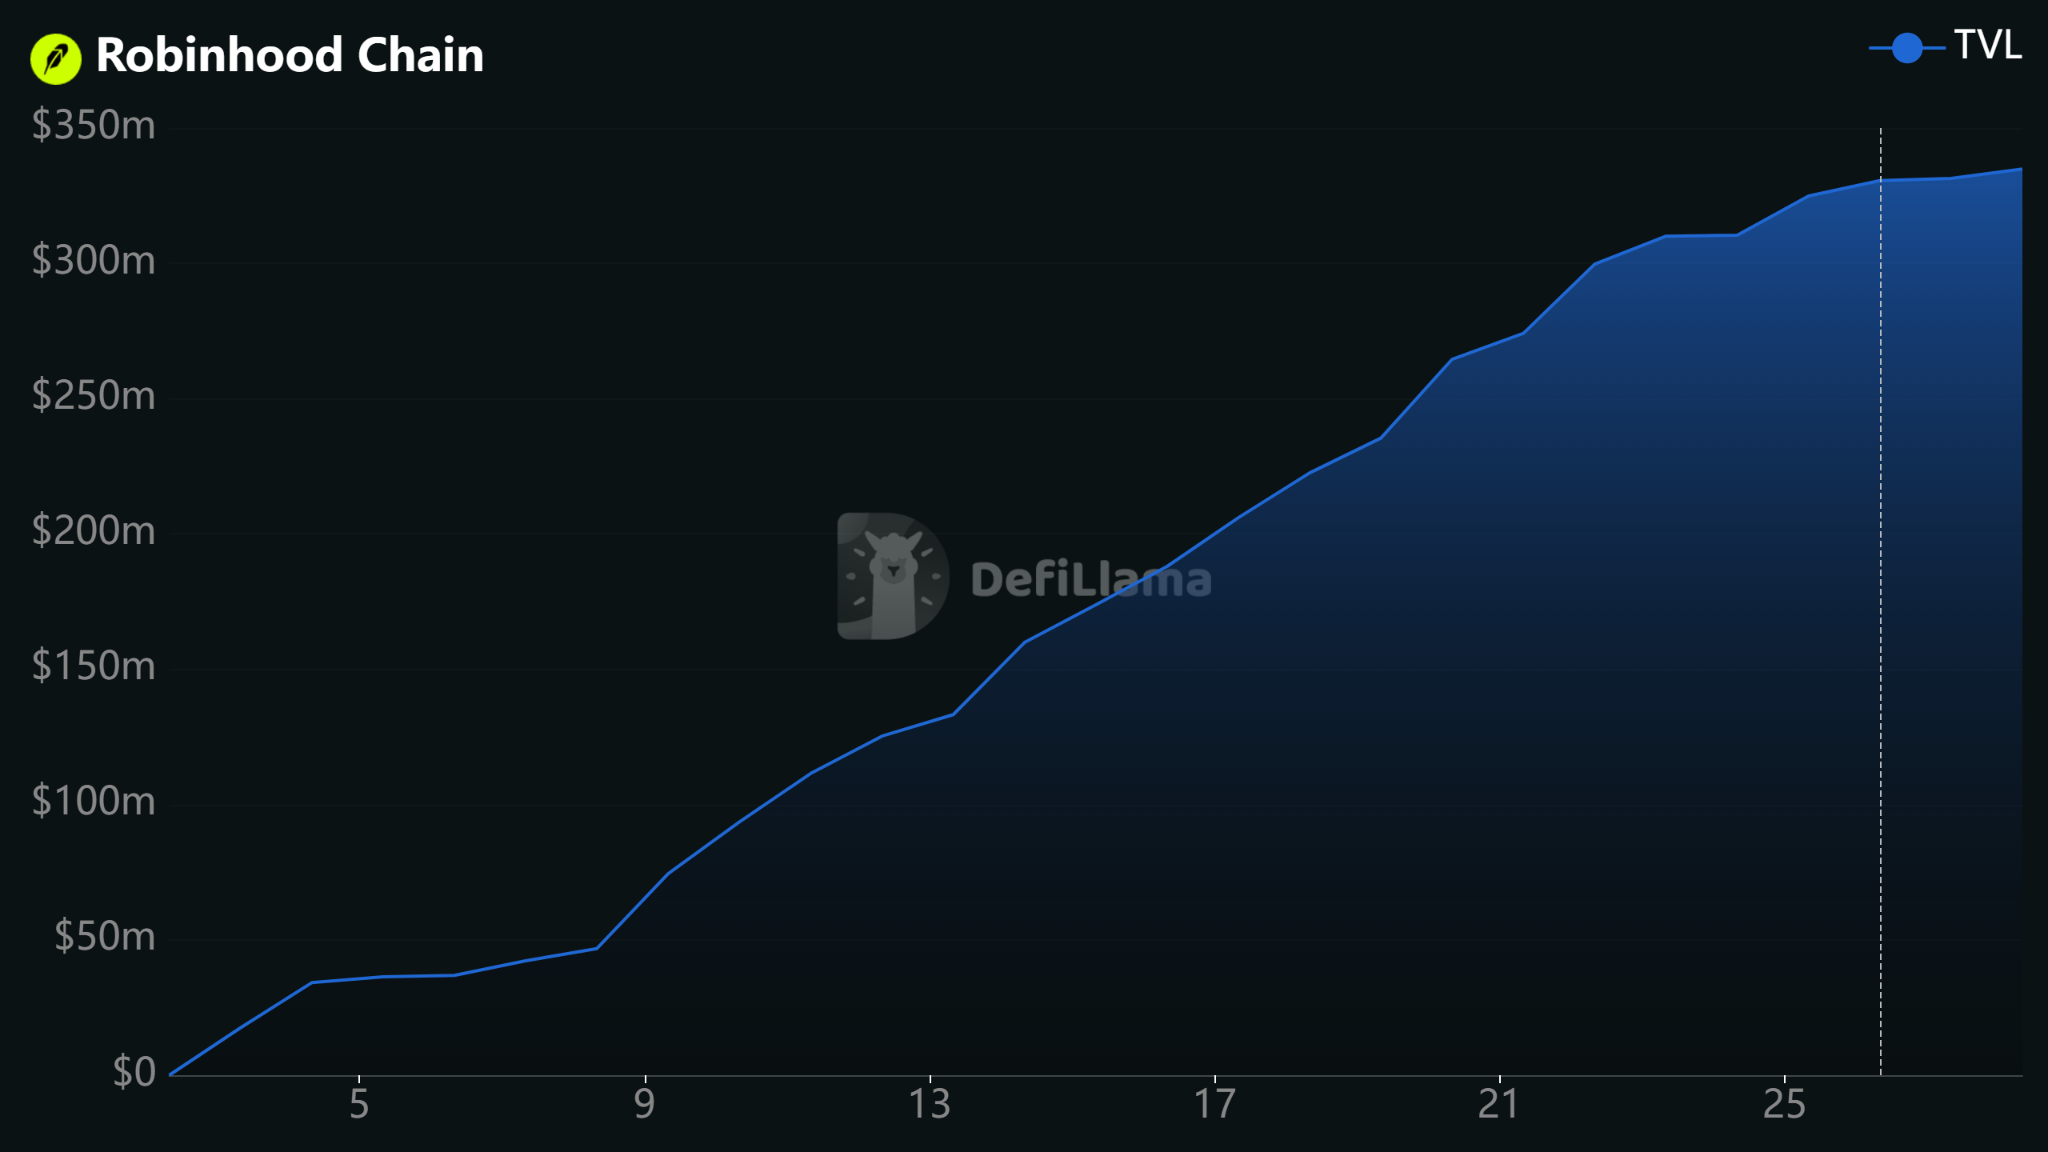
Notably, activity has been driven mostly by memecoins and stablecoins rather than RWAs, though tokenized-stock volume has grown, with reported RWA active market cap up roughly 5 times to approximately $81.1 million as of 28 July 2026
Source: DefiLlama - Robinhood Chain and Dune. See chart below
This report covers three things: the technical process for deploying on Robinhood Chain, the on-chain data available for analyzing it, and the market-structure factors research suggests are associated with token survival and trading patterns. It does not offer trading signals or promise any outcome.
For trading-data analysis and historical market-structure observations, see Part III.
PART I - Launch Data
Network Overview
- Potential distribution: Robinhood reports serving nearly 28 million customers across 38 countries. Robinhood Chain is natively integrated with Robinhood’s onchain products, although access and product availability vary by jurisdiction and user eligibility.
Source: Robinhood Chain blog - Fast and cheap: Robinhood’s public materials cite 100ms block times. Actual transaction costs vary by transaction type and network conditions rather than a single fixed figure.
- Live ecosystem: Uniswap (v3, v4, UniswapX), Morpho, Chainlink, Ethena’s USDe, and Paxos’ USDG were functional before most projects deployed.
- Room for every category. RWAs are the core focus, but memecoins and AI agents are thriving alongside them.
- EVM-compatible. Standard Solidity and tooling. No rewrites.

Verified Ecosystem Data
Robinhood Presents: The World is Flat
Robinhood Chain’s public mainnet went live July 1, 2026, at Robinhood’s “The World Is Flat” event in London. The table and figures below distinguish launch-week figures from current figures; each is dated and sourced.
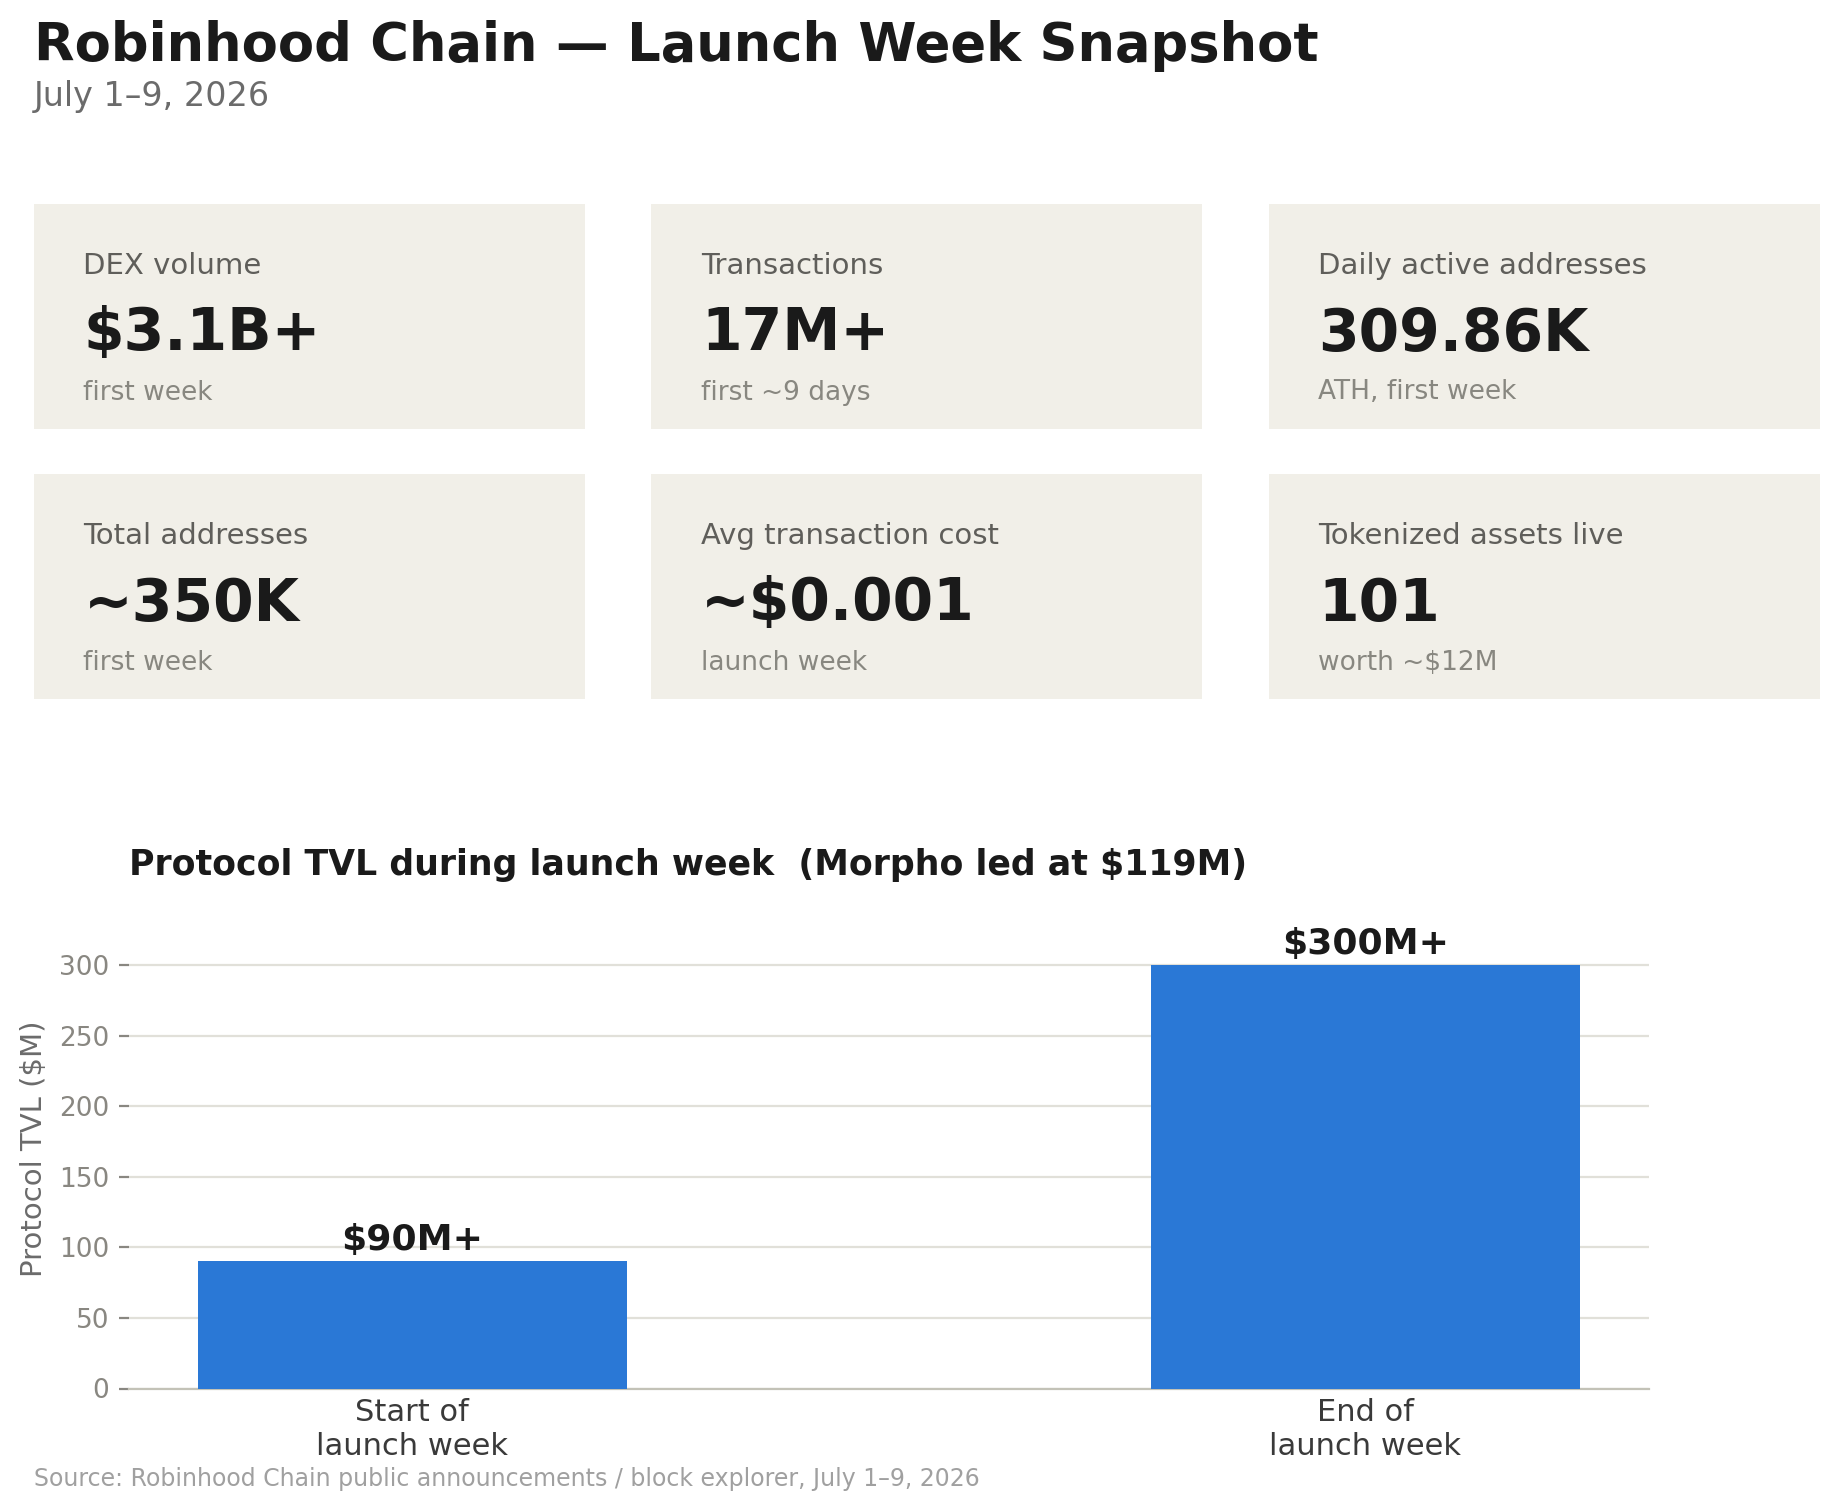
Morpho leads DeFi TVL on the chain. Vaults curated by Steakhouse Financial lend USDG against yield-bearing collateral including syrupUSDG and Ethena’s USDe.
That lending activity is what Robinhood Earn draws on.
The referenced insurance, through Lloyd’s of London and RELM, covers certain cyberattack or smart-contract exploit losses; it does not cover general investment, lending, stablecoin, or market risk, including the risk of loss from price movements or de-pegging.
Developer Deployment Overview
Security note: never paste, hardcode, or expose a private key tied to funds you cannot afford to lose, including in example code, environment files, or shared terminals. Use a secure signer or hardware wallet for any deployment involving real funds. Test on a testnet before deploying to mainnet. Have any production contract independently reviewed before deployment.
1. Prerequisites
Basic Solidity, a wallet funded with testnet ETH for initial testing (and mainnet ETH for gas once ready for production), and a plan for an independent audit before deploying anything beyond a test contract. Use a dedicated deployer wallet, separate from personal or treasury funds, ideally secured with a hardware wallet or multisig for anything beyond testing.
2. Add the Network & Bridge Assets
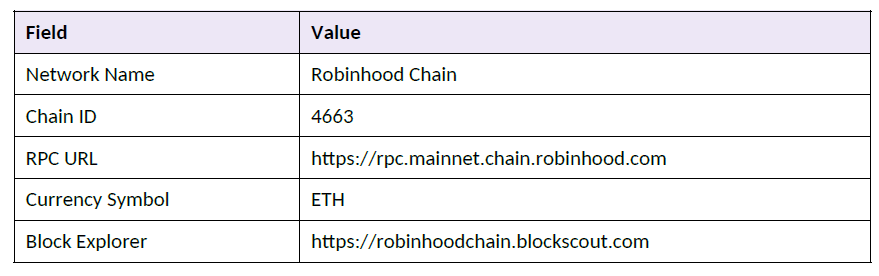
Robinhood Wallet supports the chain natively, including bridging from Solana, Ethereum, and Arbitrum. For other wallets, add the network manually. Use the canonical Arbitrum bridge for trust-minimized transfers, or Relay, LI.FI, or Backpack for speed.
3. Connect Your Infrastructure
Alchemy is the recommended RPC provider. QuickNode, Blockdaemon, dRPC, and Validation Cloud also work. viem, ethers.js, and wagmi work out of the box. The explorer is Blockscoutbased, not Etherscan.
4. Develop & Deploy Your Smart Contract
Robinhood Chain is EVM-compatible per its public documentation. Test any contract on a testnet before mainnet deployment. Minimal Foundry example (illustrative only, not audited):
// SPDX-License-Identifier: UNLICENSED pragma solidity ^0.8.13; contract HelloRobinhood { function hello() external pure returns (string memory) { return "Hello, Robinhood Chain!"; } } Confirm current chain IDs, RPC URLs, and explorer endpoints at docs.robinhood.com/chain/connecting before deploying anything - these differ between testnet and mainnet and can change, so do not rely on values cited in this or any other secondary document without checking that page first.
Testnet deployment (chain ID 46630):
Use a disposable testnet-only key, never a key tied to real funds:
forge create HelloRobinhood \
- -rpc-url <testnet_rpc_url_per_official_docs> \
- -private-key <testnet_only_key> \
- -broadcast
Mainnet deployment (chain ID 4663):
Deploy to mainnet only after testnet verification and, ideally, an independent contract review. Use a hardware wallet, keystore, or managed signer rather than a raw private key — Foundry's --account flag supports keystore-based signing:
forge create HelloRobinhood \
--rpc-url <mainnet_rpc_url_per_official_docs> \
--chain-id 4663 \
--account <keystore_account_name> \
--broadcast
Verify on Blockscout:
Match the explorer URL to whichever network you deployed to — the testnet and mainnet Blockscout endpoints are different, and using the wrong one will fail:
forge verify-contract <contract_address> \
src/HelloRobinhood.sol:HelloRobinhood \
--chain-id <4663_or_46630_as_applicable> \
--rpc-url <matching_rpc_url_per_official_docs> \
--verifier blockscout \
--verifier-url <matching_blockscout_url_per_official_docs>
For token launches, start from an audited OpenZeppelin ERC-20 base. Fair-launch or bonding-curve mechanics with immediate Uniswap liquidity have been a common patterns.
5. Launch Liquidity on Uniswap
Create a token/ETH or token/USDG pool. Seed liquidity generously to absorb early volatility. Pairing against USDG puts you in front of the chain’s deepest existing pools.
Appropriate starting liquidity depends on expected trade size, token distribution, volatility, available treasury capital and the intended maximum price impact.
There is no universally appropriate liquidity threshold.
For a detailed guide, see Uniswap’s post: blog.uniswap.org/robinhood-chain-is-live
6. Build & Integrate Your dApp
Robinhood Chain’s official infrastructure focuses on the chain itself, including RWA and stocktoken support, DeFi primitives, and the core partners named elsewhere in this report (Uniswap, Morpho, Chainlink, Ethena).
Token launchpads are separate, third-party applications, not official Robinhood products, that let users deploy tokens, often memecoins, with features such as no-code creation, bonding curves or instant liquidity provisioning, Uniswap V3/V4 pool creation, and liquidity locking.
Third-party launchpads active in ecosystem coverage include Pons, Hood.fun, Openfair, Flap, RobinPad and LaunchHood.
This list is illustrative rather than exhaustive.
Trireme has not audited or endorsed these platforms, and readers should independently verify their contracts, operational status and claimed safeguards.
Locked liquidity is a commonly claimed safeguard against one specific rug-pull method, but it does not eliminate contract risk, platform risk, or the risk of the platform itself changing or shutting down, and it should be verified on-chain rather than taken on the basis of marketing claims.
Project Categories Active on Robinhood Chain
Memecoins.
Memecoins are tokens built primarily around community, culture, or a joke rather than a stated utility or product roadmap -- value comes from attention, trading activity, and network effect rather than an underlying service. They're typically cheap and fast to launch, which makes them a natural fit for a low-fee chain like this one.
RWAs & Tokenized Assets.
Real-world assets (RWAs) are on-chain tokens that represent a claim on something that exists off-chain - a stock, an ETF, a commodity, or a lending position — rather than being a purely native crypto asset.
AI Agents & Utility Tokens.
This category covers tokens tied to a specific technical function or product - most often autonomous trading agents, automation tools, or infrastructure that other applications build on top of, rather than pure speculation or an asset-backed claim.
Projects building in this space on Robinhood Chain include Sleuth AI, Project VEX, CR33PER, and ClawHood.
Robinhood's own agent-linked account functionality - allowing automated or AI-driven trading through Robinhood Chain - is a directly relevant development for this category, since it gives these tokens a plausible path to real usage beyond speculative trading, distinct from memecoins (where usage and speculation are effectively the same thing) and RWAs (where usage is inherited from the underlying asset).
Part II - Token Survival Guide
Tokenomics That Survive Contact With the Market
A token is an incentive engine. Fundraising is a byproduct, not the purpose. Get the engine wrong and everything built on top of it breaks.
Common token-market failure modes considered in this report include: liquidity and treasury mismanagement, incentive misalignment, supply-and-demand imbalance, and poorly planned launch structures.
Design process. Start with your objective, identify stakeholders, design incentive alignment, then stress-test before you ship. Fixed-conversion minting can cause runway hyperinflation.
Controlled issuance and clearly disclosed vesting may reduce the risk of excessive near-term supply expansion, although they do not eliminate it
Supply and demand. Demand comes from users, investors, and traders. Supply comes from pre-sale investors (assume they sell), team allocations, incentive emissions, and MM arrangements. Ask at every decision: how does this change supply and demand at that date?
Velocity. High-velocity utility tokens boost volume, which suits a cheap, fast chain like this one. Staking can stabilize supply unless emissions themselves create sell pressure. Manage it with cliffs, linear unlocks, KPI-based unlocks, and claiming portals.
Communications and Disclosure Practices
This section describes how projects commonly categorize and disclose material developments. It is not guidance on timing communications to influence token price, and any such timing or coordination for that purpose would be inconsistent with fair, clear, and not-misleading communication standards that apply in many jurisdictions.
The importance of clear, compliant communications is increasing year to year as different jurisdictions introduce new regulatory frameworks like the EU's MiCA framework.
What Constitutes a Material Development
Roadmap milestones, product releases, exchange listings, partnerships, real-world adoption, and ecosystem expansion are commonly treated as material developments worth disclosing. A reasonable test: would this be newsworthy on its own factual merits, independent of any effect on token price?
Categorizing Developments
Significant: major exchange listings, major partnerships, major product releases. On Robinhood Chain, this could include a listing on Robinhood's own platform or a partnership with an established protocol such as Morpho, Uniswap, or Chainlink.
Moderate: secondary listings, feature expansions, metrics milestones.
Minor: UI improvements, community initiatives, smaller partnerships.
Disclosure Practices
Vague or unsubstantiated claims ("major announcement coming soon" with no verifiable detail) are increasingly scrutinized by regulators and by market participants, and can themselves raise fair-and-clear-communication concerns. Disclosures are generally better received, and less likely to raise regulatory concern, when they are factual, specific, and issued when the underlying development is actually confirmed, rather than teased in advance.
Planning Disclosures
Projects commonly plan disclosure of multiple developments across a year rather than concentrating all communication around a single event. Regardless of scale, the same standard applies: disclosures should be accurate, substantiated, and not framed or timed for the purpose of influencing token price or creating trading activity.
Addressing Different Audiences
- To users: what a development changes about the product's usability or value.
- To investors: what a development means for the project's fundamentals, referencing verifiable facts.
- To the broader market: a factual account of what changed and when, without speculative framing about price trajectory.
The same underlying development can be communicated to each audience using accurate, non-promotional language suited to what that audience needs to know.
Liquidity and Market Structure Considerations
Liquidity depth is a significant factor in a token's price stability and in whether it can support meaningful trading activity without excessive slippage. Thin liquidity is generally associated with higher volatility and higher risk of sharp price movements on modest trade sizes.
Structural Sequencing
Projects typically need to plan four elements together: exchange listings, DEX pool timing, token distribution, and public communications. The order and coordination of these elements affects market outcomes, and should be planned with the objective of an orderly, transparent market rather than to create a particular price impression.
Exchange Listings
A centralized exchange listing may provide an additional venue with an observable order book, although regulatory status, protections, listing standards and market quality vary significantly by venue and jurisdiction.
DEX Pools
Where a project also seeds a DEX pool, doing so with adequate depth reduces slippage and reduces the risk that thin, unofficial pools created by third parties before an official pool create a misleading early price.
Appropriate starting liquidity depends on expected trade size, token distribution, volatility, available treasury capital and the intended maximum price impact. There is no universally appropriate liquidity threshold.
Token Distribution
Distribution mechanics (timing, claiming portals, vesting) affect the pace at which recipients can sell. Any assumptions about recipient selling behavior should be disclosed, and distribution mechanics should be designed for orderly market function, not to obscure available supply from the market.
Unlock Structures
Block unlocks distribute all tokens at a single point and are simpler to plan around. Linear unlocks distribute continuously and are often used for smaller allocations. Milestone-based unlocks tie additional supply to specified, objective conditions. Whichever structure is used, the schedule and its rationale should be disclosed.
Public Communications
Announcements should be issued when the underlying development is genuinely ready to disclose, based on factual accuracy and completeness, not timed to coincide with a particular trading condition for the purpose of influencing price.
DEX Activity and Exchange Listings
A project's DEX trading history and any future centralized listing exist within the same broader market. Listing evaluators commonly weigh sustained organic volume (as opposed to a single spike), liquidity resilience, compliance readiness, and genuine community engagement.
Engaging Market-Making Partners
- Initiate discussions with prospective liquidity partners well before liquidity support is needed.
- Prepare documentation covering supply schedule, treasury structure, and incentive design.
- Disclose vesting and unlock schedules accurately, as these inform a partner's risk assessment.
- Consider starting with a smaller, clearly scoped engagement.
Metrics commonly monitored:
- 24-hour and 7-day DEX volume
- Liquidity depth at realistic trade sizes
- Bid-ask spreads
- Holder distribution and concentration
- Order book depth across price levels
Part III - Trading Patterns
Trader Outcomes and Market Concentration
Volume alone indicates activity, not outcomes.
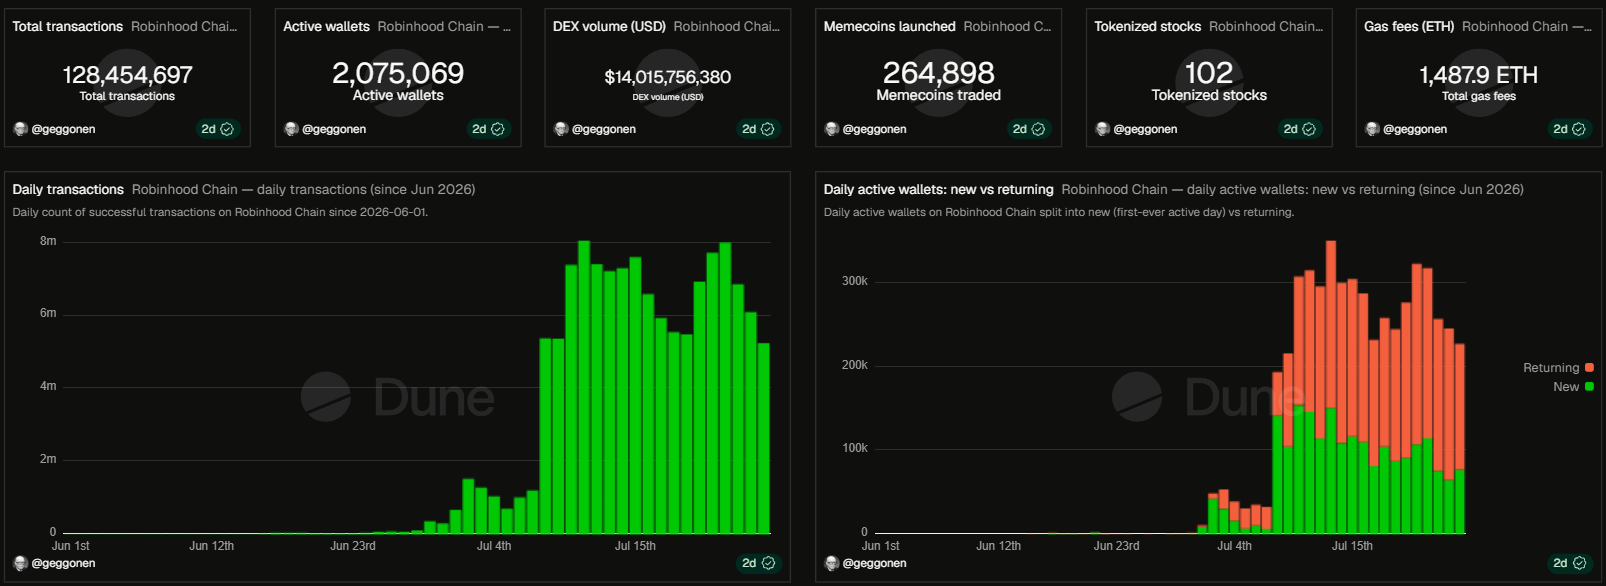
Updated cumulative stats (as of ~July 28, 2026, source: Dune, @geggonen – see Sources and Methodology for the dashboard link and retrieval time):
Up from 49.4M transactions, 937,903 wallets, and $5.5B+ cumulative volume in the prior snapshot — transactions have roughly 2.6 times and cumulative volume has roughly 2.5 times since mid-July.)
Daily transactions and DEX volume, updated: Daily transactions peaked near 7-8M/day around July 15-18, slightly later than the July 11-13 peak cited in the prior update, and have moderated somewhat since, but remain elevated through the most recent data available (July 26), still running well above the June baseline of near-zero.
Daily DEX volume shows the same pattern: it peaked near $1B+/day around mid-July and has since settled into a lower but still substantial range.
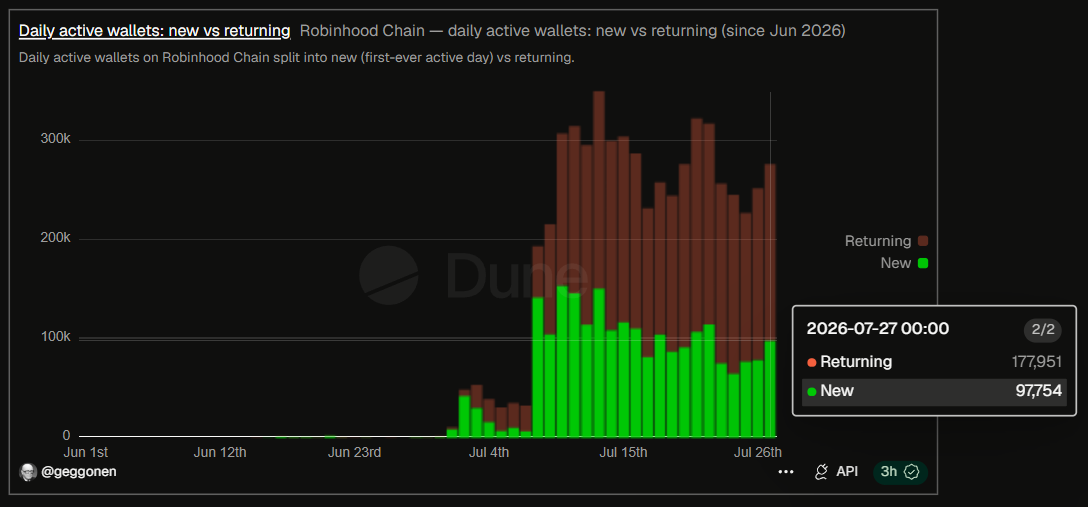
New vs. returning wallets, updated: The gap between returning and new wallets has widened further since the July 13 snapshot
The updated chart shows returning wallets (orange) consistently and more visibly outnumbering new wallets (green) across the stretch from mid-July onward, a more pronounced version of the same pattern - though this report doesn't have an exact day-by-day figure past July 13 to cite a precise updated ratio, only the shape of the chart itself.
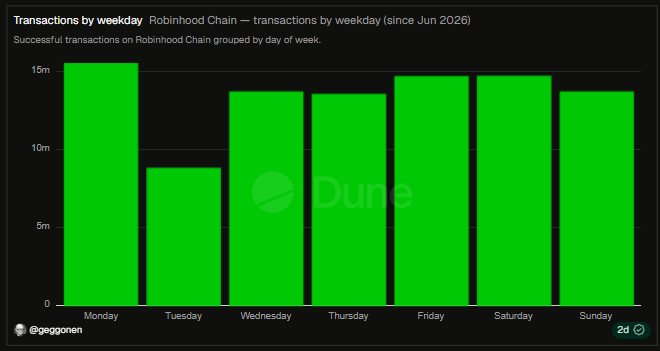
Transaction volume is lowest on Tuesdays, based on the sample to date. This is a descriptive observation about historical activity, not a recommendation about when to transact or announce anything.
Token Market-Structure Review Checklist
- Liquidity depth: what price impact would a realistically sized trade create, not just the headline liquidity figure. Thin depth can allow a $5,000 trade to move price materially.
- Holder concentration: review the deployer wallet and top 5-10 holders. High concentration is a risk indicator warranting further diligence.
- Early trade patterns: a large share of supply acquired within the first block or two may indicate automated rather than organic early demand.
- Contract review: verify the contract on Blockscout and check for mint functions, transfer taxes, or blacklist functions. Independent contract review is recommended before any material capital commitment.
- Launchpad history: the deployment platform's track record and any built-in safeguards are one relevant data point among several, not a standalone safety signal.
- Volume-to-holder ratio: high volume alongside a static holder count is a pattern associated with wash trading and warrants further review.
- Automated screening tools: rug-check and similar tools are useful as an initial screen for known patterns. They do not detect novel exploits and should not be relied on as a sole diligence step.
Observed Market-cap Zones in Early Robinhood Chain Trading
Where Trading Activity Began to Expand
To examine when early Robinhood Chain tokens began attracting more sustained market participation, we reviewed the market-cap & price behaviour of seven selected tokens identified through Robinhood Chain DEX data as of July 28, 2026.
We reviewed these tokens from July 13 to capture the actual price action and identify where the potential zones of expansion were.
Methodology
- Selection: tokens are re-selected on a rolling weekly basis, starting the week of July 13, 2026, so that each week's set of tokens captures that week's full price action rather than being fixed once at the outset.
- Data sources: the token is drawn from Uniswap's Robinhood Chain token explorer (app.uniswap.org/explore/tokens/robinhood), and each week's top tokens are identified from the Dune dashboard at dune.com/geggonen/robinhood-chain-analytics.
- Cutoff: July 28, 2026, times as displayed on Dexscreener/Dune/Uniswap at the point of review; exact timezone and retrieval timestamp not logged per chart.
- Market cap basis: figures quoted are Dexscreener's displayed market cap, not FDV and not an independently verified circulating-supply figure.
- Liquidity, volume and price: taken from the single WETH-paired pool for each token, not aggregated across multiple pools.
- Chart interpretation: charts were manually interpreted based on intraday technical analysis, not a systematic or algorithmic method.
- Scope of review: this review is based on market cap and technical analysis only - it does not include holder-concentration, wallet, or contract-level diligence.
- Holder and wallet attribution: contract ownership, deployer identity, and related-wallet activity were not independently attributed unless explicitly stated.
Across this limited sample, trading activity frequently expanded as tokens moved through several recurring market-cap zones: approximately $250,000, $500,000 and $800,000–$1 million.
These are historical observations - not price targets, entry signals or thresholds that every token can be expected to reach. The sample consists of tokens that had already achieved relatively high trading volume and is therefore subject to selection and survivorship bias.
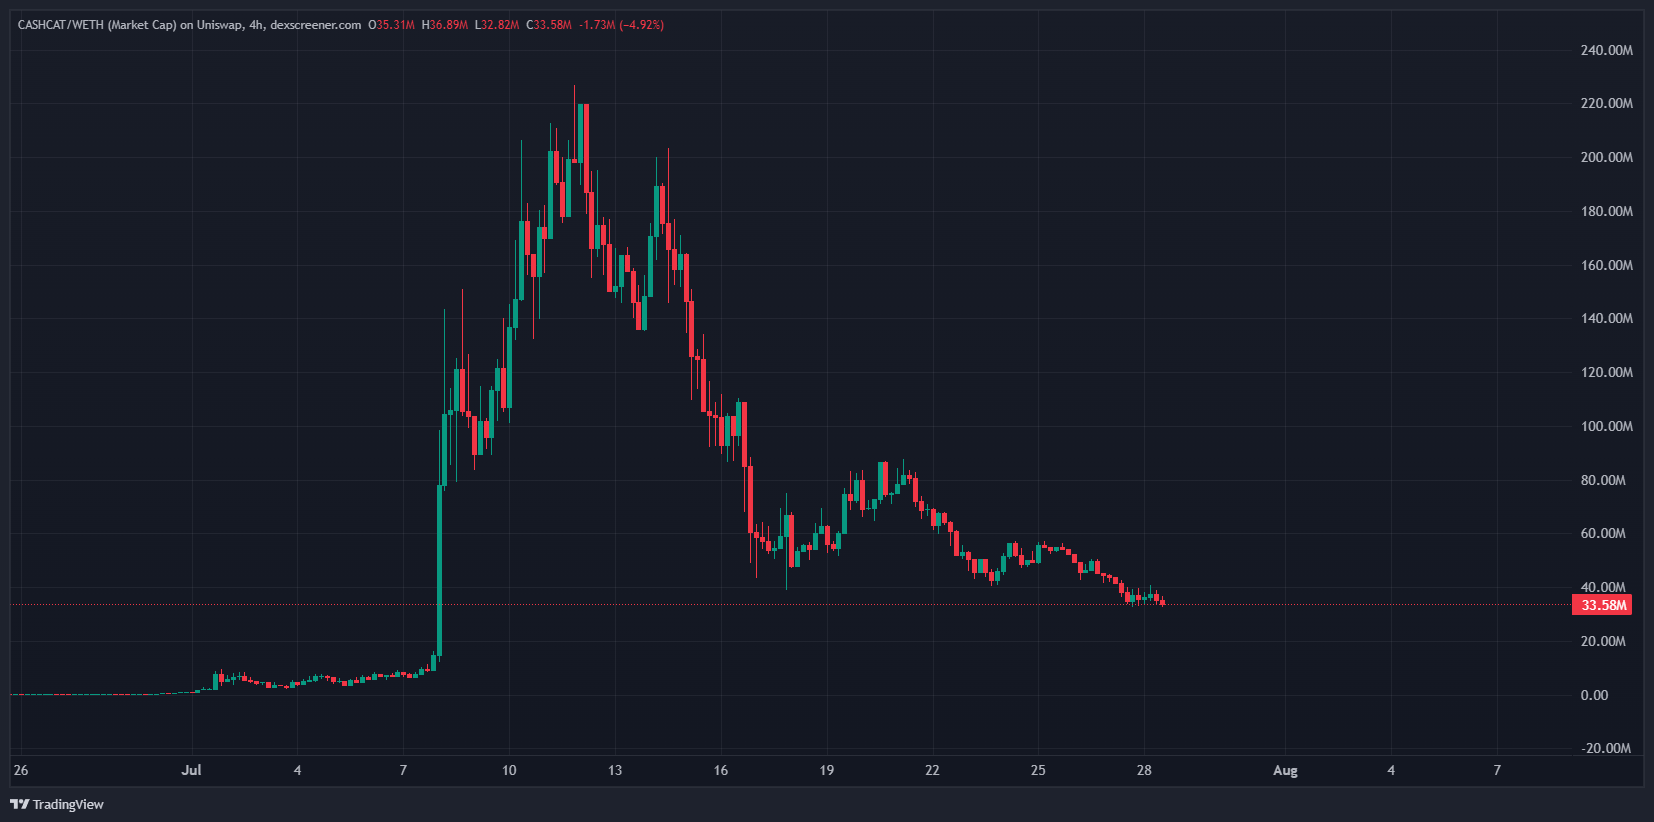
$CASHCAT/WETH
$CASHCAT first attracted meaningful activity after moving above approximately $1 million in market cap. Its strongest acceleration occurred after it passed $10 million, before reaching a peak of approximately $227 million.
As of 28 July 2026, it remained at approximately $33 million.
Within this sample, $CASHCAT is an exceptional outlier rather than a representative result. Its performance should not be treated as a reasonable expectation for other tokens launching on the network.
$PONS/WETH
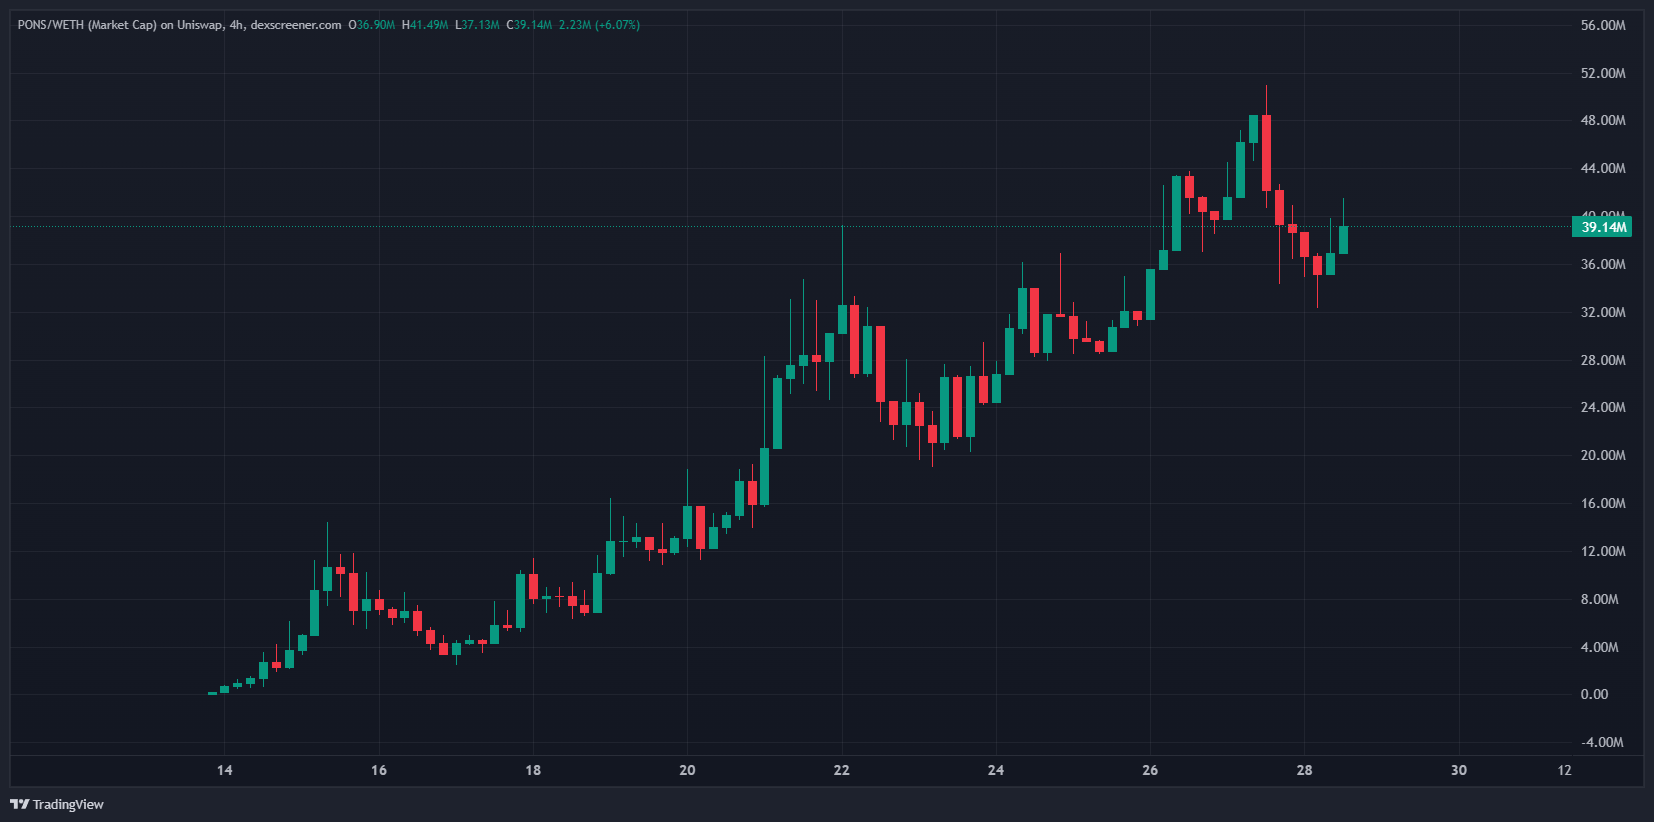
Shows a different pattern from the other tokens reviewed in this section: rather than a single spike-and-fade or a one-time breakout, it has advanced through several distinct expansion-and-consolidation cycles since mid-July.
Market cap rose from near zero around July 14 to approximately $12 million by July 16, consolidated in a roughly $4-8 million range through July 17-19, then expanded again to a peak near $32-40 million around July 22.
It consolidated a second time in the $20-24 million range from July 22-25, before expanding a third time to a peak near $52 million around July 28.
As of this review, it trades at approximately $36.1 million, having pulled back from that most recent peak.
This step-pattern, expansion, consolidation at a higher base, further expansion, is distinct from the single-peak examples elsewhere in this section ($CASHCAT, $BOW, $HOODIE) and worth noting as a separate category: repeated cycles of expansion and consolidation, each establishing a higher floor than the last.
Whether this represents durable, staged growth or an extended version of the same retracement risk seen in other tokens is not yet resolved, and it should be read as an open, in-progress pattern rather than a completed one.
It's also worth noting that $PONS is associated with the Pons launchpad referenced elsewhere in this report, which may be a relevant factor in its trading activity and should be considered alongside the other diligence factors in the Token Market-Structure Review Checklist.
$BOW/WETH
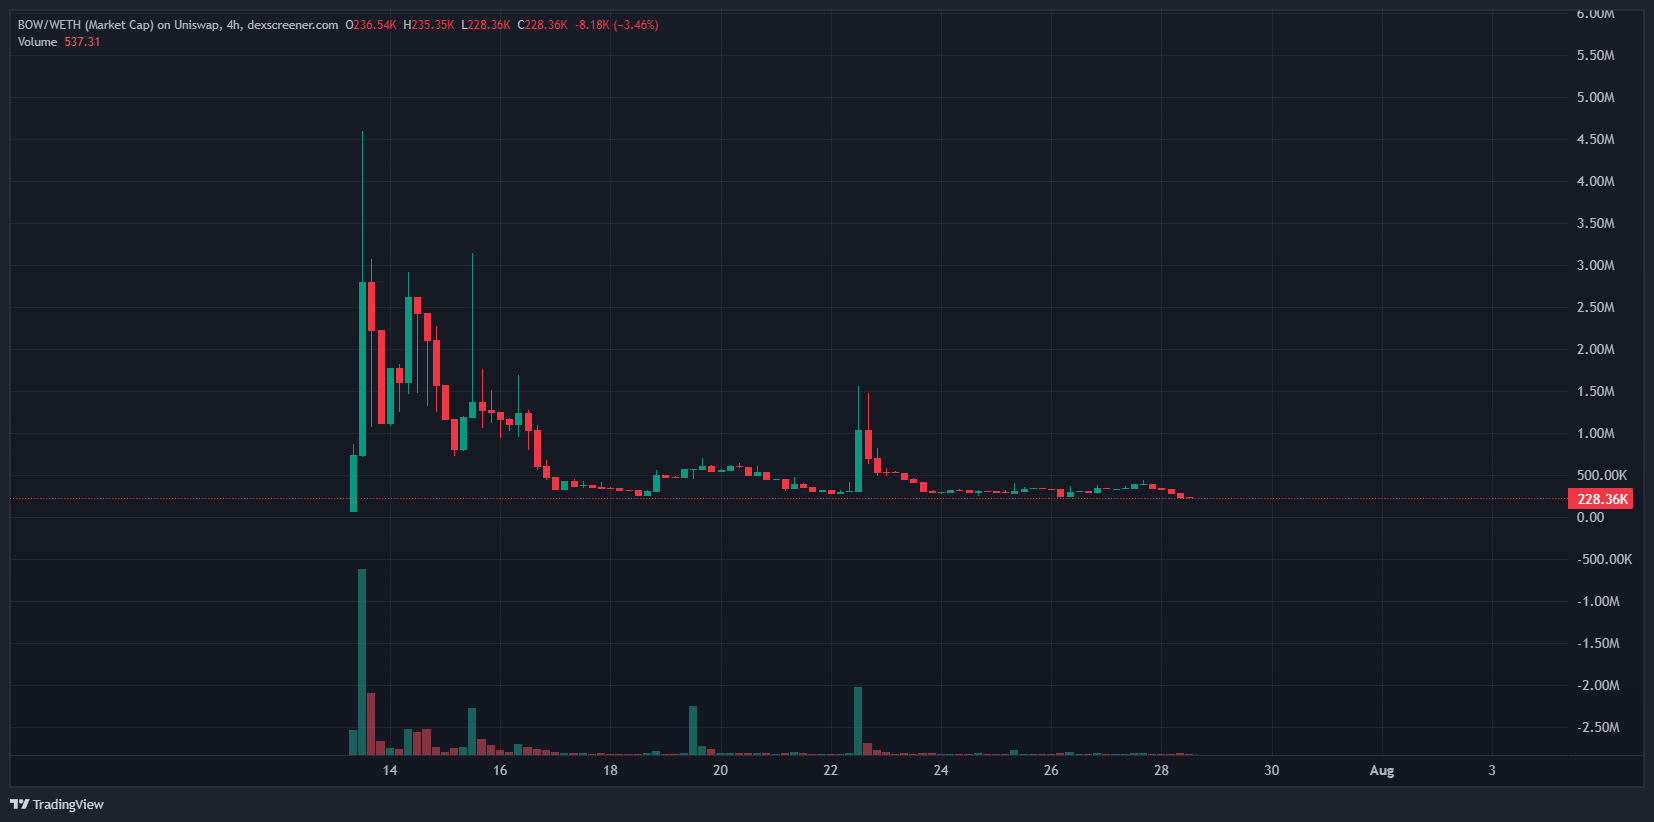
$BOW's earliest expansion in trading activity occurred as its market cap moved from approximately $800,000 towards $1 million.
From there, the token spiked sharply to a peak near $4.4 million around July 14, before reversing. It staged two further, progressively smaller secondary peaks, near $3 million in the days that followed and again near $1.5 million around July 23, each one fading back down.
Since late July, $BOW has traded in a narrow, low-activity range and sits at approximately $232,630 as of July 28, 2026 - below the $800,000-$1 million zone where its expansion first began.
$530A/WETH
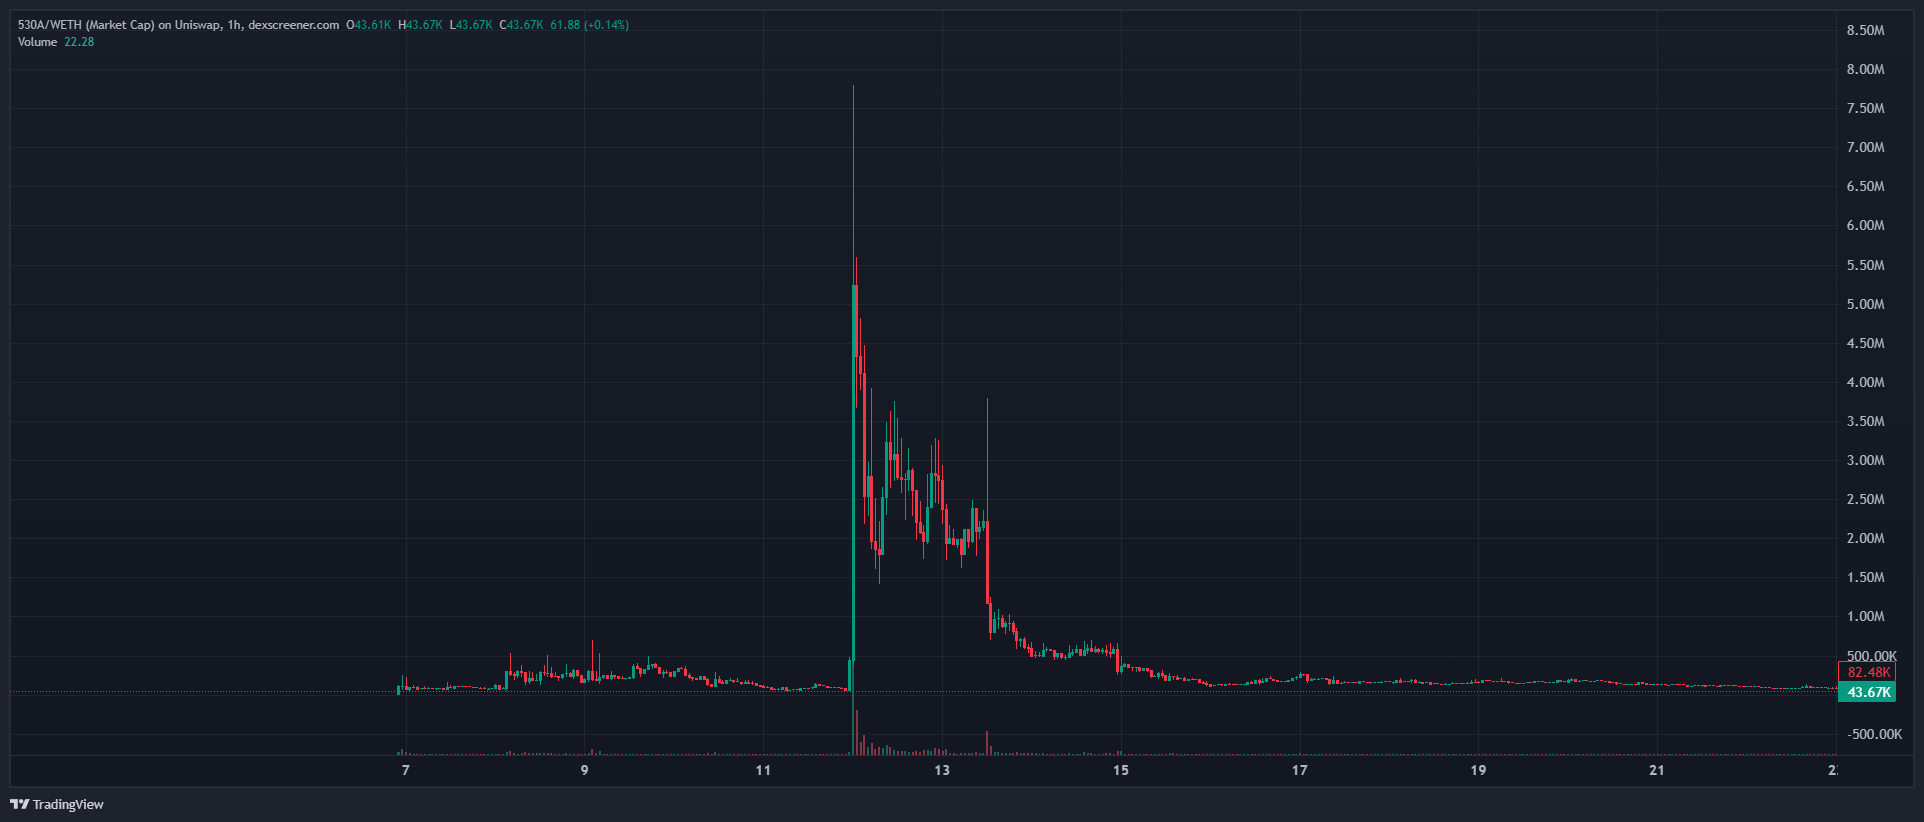
Trading interest in $530A began increasing above approximately $250,000, with a more substantial expansion in activity occurring between approximately $500,000 and $1 million.
The distinction was meaningful at the time: the lower level coincided with early signs of participation, while the higher range coincided with stronger volume and wider market attention.
From that base, $530A spiked sharply to a peak near $8 million around July 12, then reversed almost immediately.
It traded in a volatile, elevated range between roughly $2-4 million for a few days afterward, before breaking down through a steep, near-continuous decline from around July 13 through July 15.
Since approximately July 15, it has traded in a flat, extremely low range, and sits at approximately $43k market cap as of the most recent data reviewed.
$IF/WETH
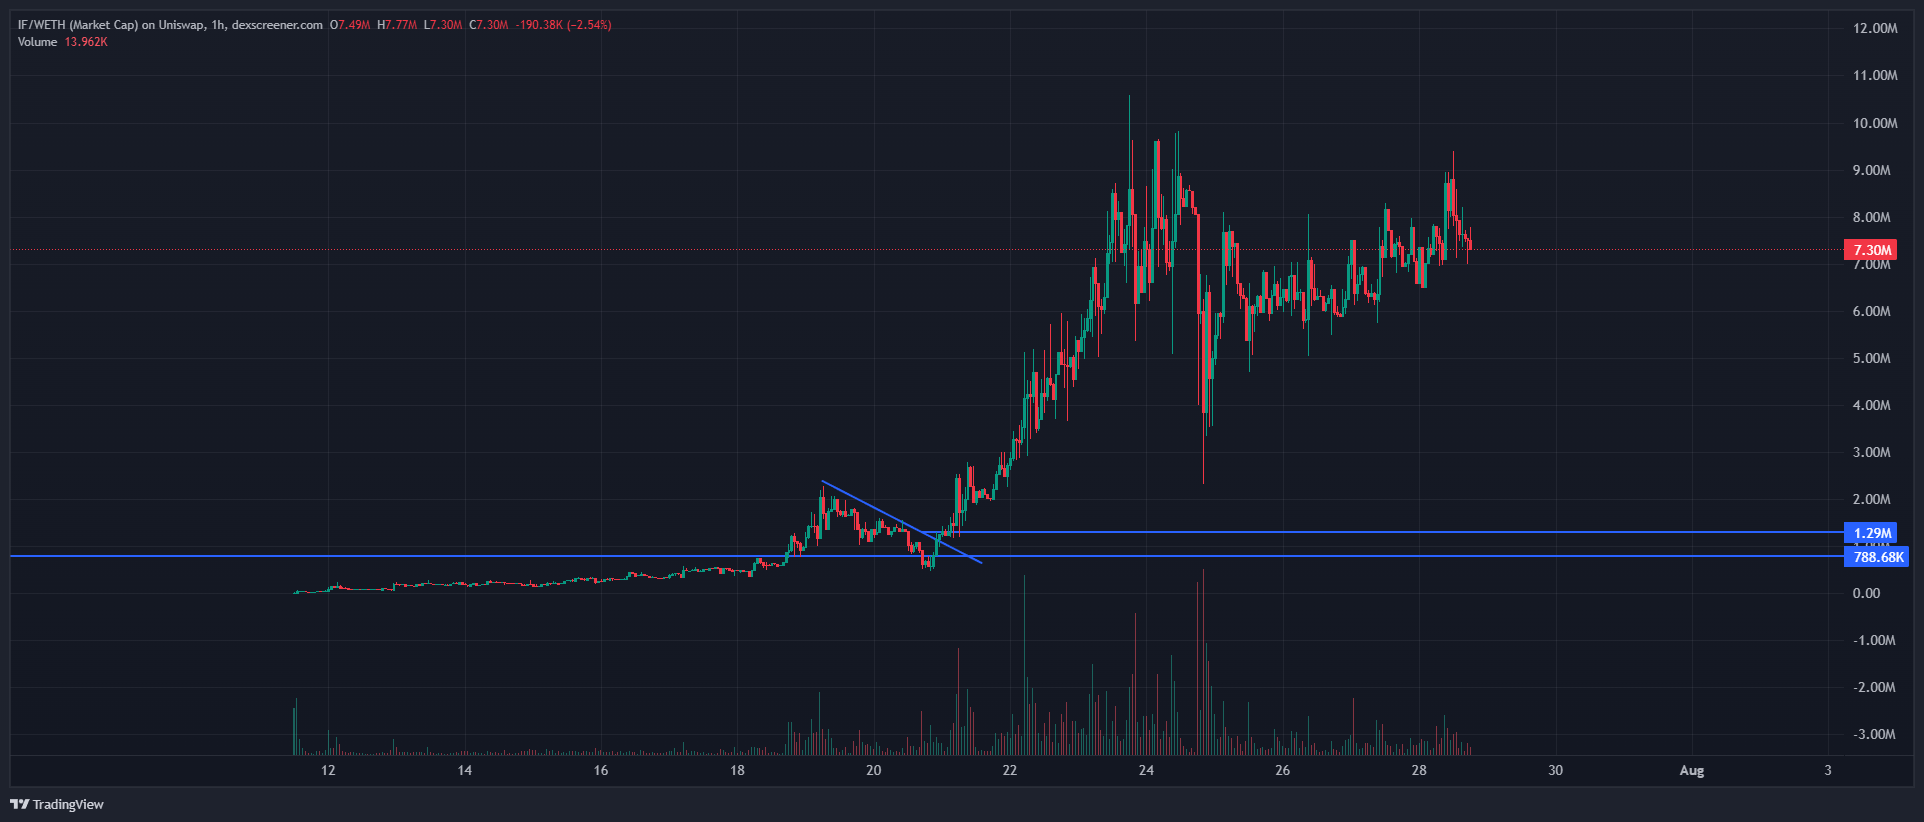
$IF traded in a flat, near-zero range through approximately July 18, before an initial move up to a small consolidation zone between roughly $788,000 and $1.29 million from July 19-21, a range that roughly straddles the $800,000-$1 million higher-activity zone.
From there, it broke out into a sustained uptrend, expanding from that consolidation base to a peak near $10 million around July 24. It then pulled back sharply to approximately $4-5 million within the same day, before recovering back into a higher range, trading between roughly $7-9 million from July 25 onward.
As of the most recent data reviewed, it sits at approximately $7.3 million, down 2.54% over the preceding session.
This pattern - a consolidation at the 800,000-$1 million zone followed by sustained expansion, rather than an immediate fade - places $IF closer to the $PONS example than to the single-peak spike-and-fade cases.
$HOODIE/WETH: A Two-Stage Spike-and-Fade Example
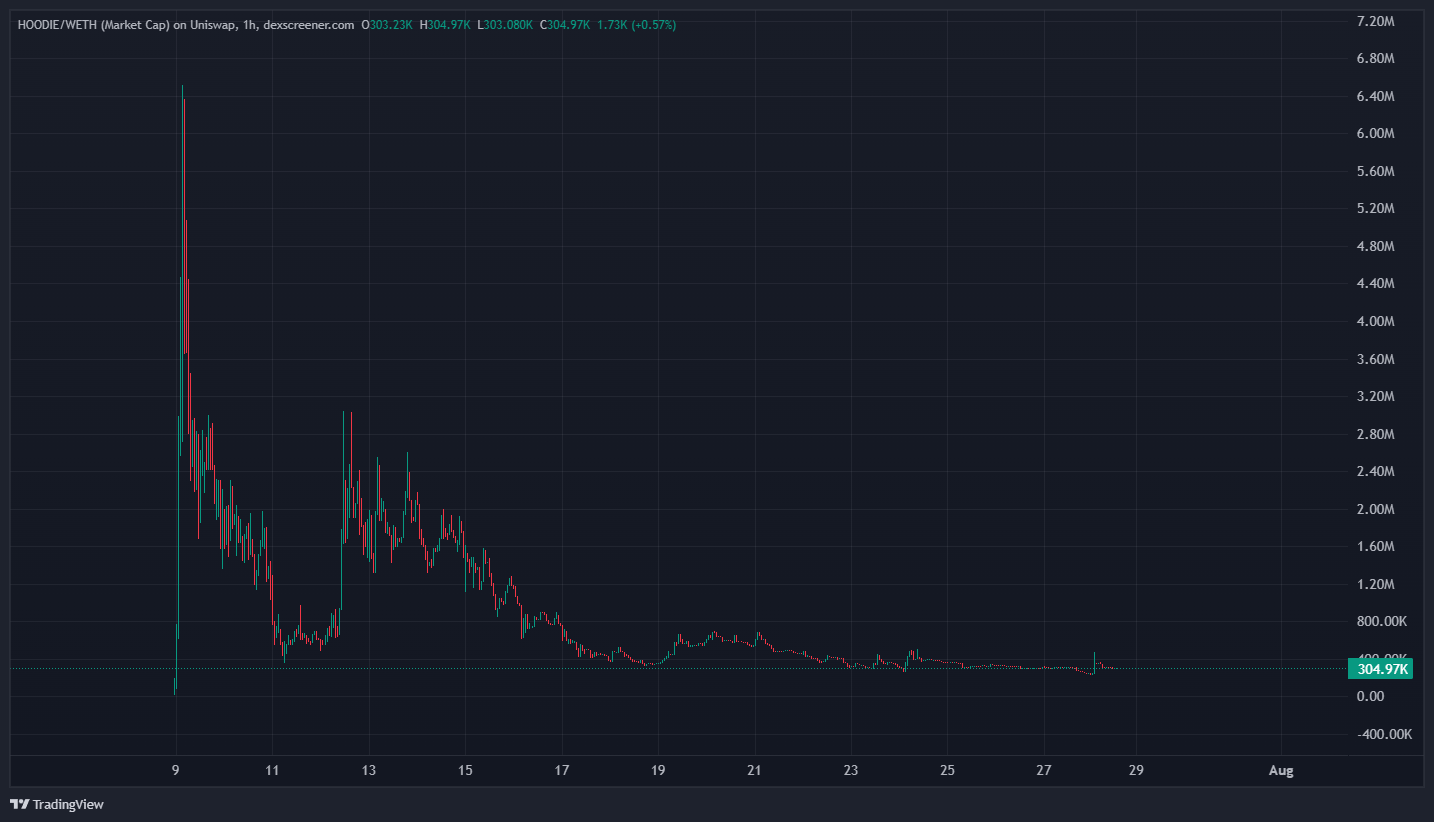
Launched with an extreme single-session spike to a peak near $6.4 million in market cap around July 9, before collapsing to under $1 million within roughly a day.
It then staged a smaller secondary rally, reaching approximately $2.8-3 million between July 12 and July 14, before entering a sustained decline through mid-July.
Since approximately July 19, it has traded in a narrow, low-volatility range roughly between $300,000 and $500,000, and sits at approximately $304,970 as of July 28, 2026, essentially flat (+0.57%) with minimal recent price movement.
This token illustrates a different failure pattern than $BOW: rather than a single expansion and retracement, $HOODIE/WETH produced two distinct upward moves, both of which fully reversed, before settling into an extended low-activity baseline roughly ten days long.
Unlike $CASHCAT, neither of $HOODIE's two peaks converted into sustained participation, and unlike the still-unresolved $Jimothy/WETH example, this pattern now appears largely complete: nearly two weeks of flat, low-volatility trading suggests the token has settled into its post-speculation baseline rather than being mid-retest.
$Jimothy/WETH
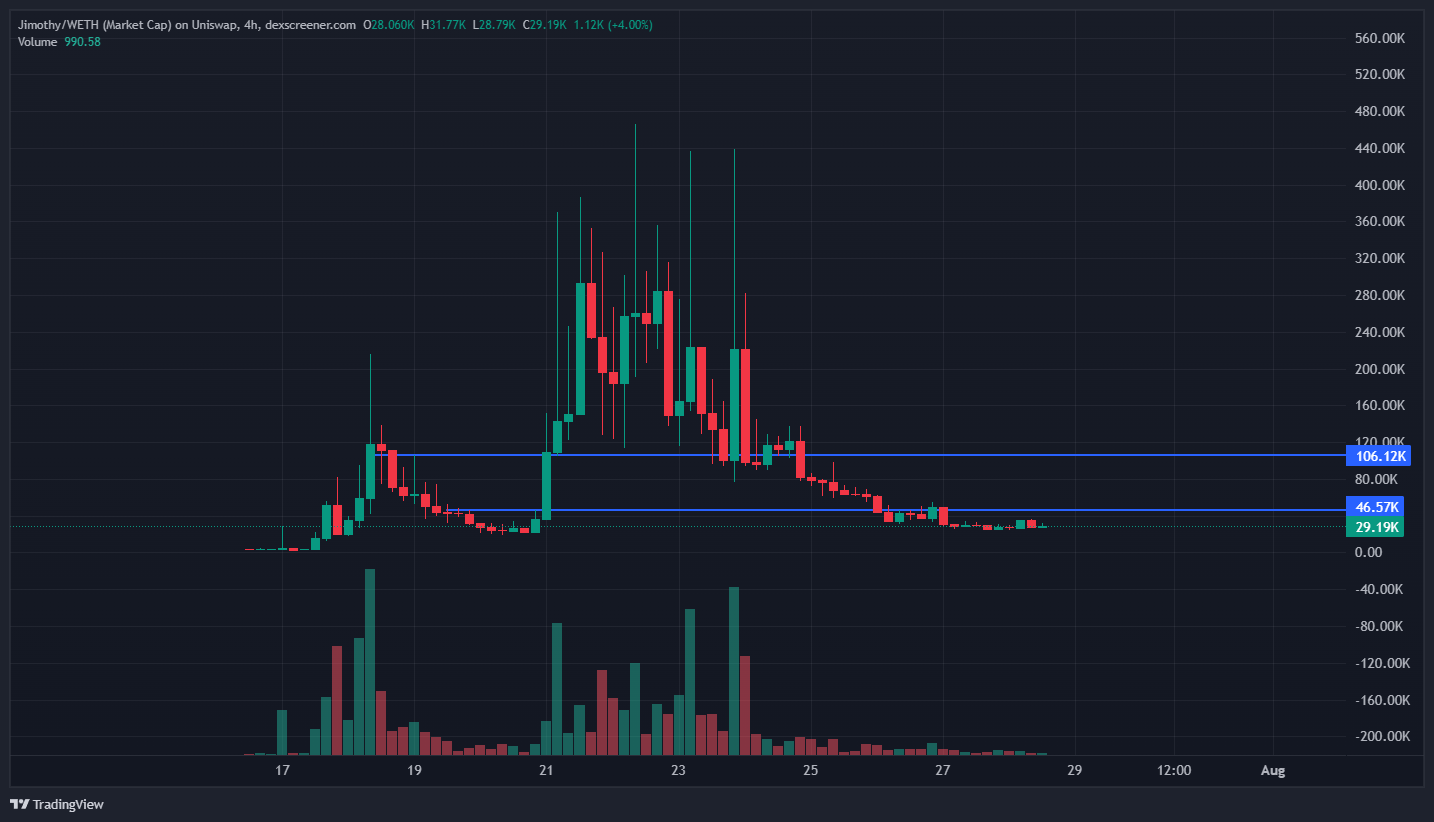
A smaller-cap, more recent example. Its pair was created approximately 8 days before this review.
It expanded from a base near $40,000-$50,000 to a peak near $475,000-$500,000, before retracing into a range of approximately $46,500-$106,000, where it has traded for the past several days.
As of the most recent data reviewed, it sits at approximately $83,600 in market cap, down roughly 34% over the preceding 24 hours, with 289 traders and roughly even buy/sell volume ($59K bought, $61K sold).
Its post-peak range remained materially below the approximately $250,000 activity zone observed in several of the larger examples. It is therefore presented as an unresolved smaller-cap counter-example rather than evidence supporting that zone.
These observations were drawn from a small number of high-volume tokens and should not be assumed to apply across the wider Robinhood Chain token market.
Cross-Sample Observations
Within the tokens reviewed, three broad zones appeared repeatedly:
Approximately $250,000: Early activity expansion in parts of the sample.
For some tokens, this was the point at which activity began extending beyond the immediate launch period.
Crossing this level alone did not establish sustainable demand.
Traders would still need to examine liquidity depth, holder distribution, wallet concentration and whether activity continued after the initial move.
Approximately $500,000: Broader participation observed in the sample.
Several tokens experienced increasing turnover and market attention around this area.
The level was more meaningful where the increase was accompanied by: deeper executable liquidity; growth in unique holders and traders; sustained rather than single-session volume; less concentrated wallet activity; and continued trading following an initial pullback.
Approximately $800,000–$1 million: Higher-activity zone within the selected sample.
This was the commonly observed zone associated with expanding activity among the tokens reviewed. However, the apparent pattern may partly reflect survivorship bias: tokens that failed before reaching this range are naturally absent from an analysis of the highest-volume names.
Above $10 million: exceptional rather than typical.
CASHCAT is the clearest case of sustained acceleration beyond $10 million; $IF briefly touched this level (peaking near $10M) before settling back to $7.3M.
This should still be treated as a comparatively rare outcome requiring considerably broader participation, liquidity and continued market interest, not as a normal extension of the earlier zones.
Short-Term Cycle, or Early Signs of a Longer-Term Trend?
The data available to date does not yet settle this question, and this report treats it as genuinely open rather than forcing a conclusion the evidence doesn't support.
The token-level pattern and the ecosystem-level pattern are behaving differently, and they are best evaluated separately rather than folded into a single combined trend.
At the individual token level, the evidence to date points toward a short-term, rotating speculative cycle rather than a durable step-change — though the picture is more mixed than an earlier, smaller snapshot suggested.
As of July 28, 2026 - of the seven tokens reviewed: CASHCAT remained materially below its peak and had not established a sustained consolidation range within the period reviewed.
$BOW and $530A expanded through the zones discussed in this report, spiked, and then round-tripped back below their original expansion ranges entirely.
$HOODIE produced two separate speculative peaks that both fully reversed before settling into a flat, low-activity baseline above zero. $Jimothy is small-cap and unresolved.
$PONS and $IF both show patterns that could be read as more durable: $PONS through repeated expansion-and-consolidation cycles each establishing a higher floor, and $IF through a single consolidation followed by a sustained multi-day expansion that remained above its earlier consolidation range as of the cutoff.
Both, however, have pulled back from their most recent peaks, and two tokens following this pattern within a seven-token sample is still a small basis for calling it a trend rather than a coincidence of timing.
Taken together, the more common outcome in this sample remains a single (or double) cycle followed by fading activity, which is consistent with a short-duration speculative cycle, although this report did not conduct a cross-chain comparison and cannot determine whether the pattern is unusual for Robinhood yet.
But the $PONS and $IF cases are enough to say the sample is not uniformly one-directional, and that outcome depends heavily on which token is examined.
The honest summary, given the data available today: this report cannot yet distinguish whether Robinhood Chain represents a durable new venue that will support a healthier token ecosystem over time, or whether current ecosystem-level growth is itself still in an early, hype-driven phase that has not yet been tested by a full market cycle.
A longer observation window, ideally spanning a broader downturn or consolidation period across the wider crypto market and not just this chain specifically, would be needed before drawing a firmer conclusion.
Readers should treat the token-level pattern (mostly short-term, rotating speculative cycles, with a minority of exceptions) and the ecosystem-level pattern (infrastructure and integration growth that has continued past the initial launch window) as two separate, only loosely related observations, not as a single combined verdict on the chain's prospects.
Retests and Market Response
Across the sample, some of the strongest buying activity occurred when tokens returned towards previously established market-cap zones after an initial upward move.
A retest followed by continued activity may indicate that market participants continue to transact around that valuation. However, it is not conclusive evidence of future appreciation.
A breakdown below the same area - particularly when accompanied by declining liquidity, shrinking holder activity or concentrated selling—may indicate that the earlier pattern has failed.
Because market cap can be materially affected by thin liquidity, traders should never interpret a quoted valuation independently of the pool’s executable depth.
How Traders Can Interpret These Zones
The observed levels are best used as reference points for further investigation rather than standalone trading signals.
Before drawing a conclusion from any market-cap threshold, examine:
- Executable liquidity: What price impact would a realistically sized purchase or sale create?
- Volume quality: Is turnover distributed across independent wallets or concentrated among a small number of addresses?
- Holder growth: Is participation expanding alongside price and volume?
- Supply concentration: How much supply is controlled by the deployer, team and largest wallets?
- Activity retention: Does trading continue after the initial launch or breakout period?
- Contract risk: Can additional tokens be minted, transfers restricted or transaction taxes changed?
- Market structure: Is the apparent market-cap increase supported by two-way liquidity, or only by a small number of purchases?
A token crossing one of the observed zones without improvement in these supporting indicators may be producing a misleading market-cap signal.
Limitations
This analysis covers a selected group of high-volume tokens during the early development of Robinhood Chain.
The findings may be affected by:
- selection and survivorship bias;
- changing network conditions;
- thin or fragmented liquidity;
- wash trading or coordinated wallet activity;
- differences in circulating-supply calculations;
- incomplete wallet attribution; and
- the short operating history of the network.
The analysis does not establish a causal relationship between a particular market-cap level and subsequent token performance. The identified zones should be understood as historical areas of increased activity within the reviewed sample, not as forecasts, recommendations or assurances of future results.
Conclusion
Robinhood Chain's first month shows a network that moved fast on two fronts at once: real infrastructure (Uniswap, Morpho, Chainlink, and a growing list of exchange, wallet, and security integrations) alongside real speculative activity (memecoin volume that, per the data reviewed in this report, has outpaced RWA activity so far, even though RWAs remain the network's stated core focus).
Both are genuine signals, and neither on its own tells the full story of what this chain becomes.
The more useful takeaway is about durability, not any single statistic.
Across the tokens and data reviewed in this report, a small number of names accounted for a disproportionate share of trading activity, and most new tokens did not retain meaningful activity for long.
That pattern is common to new, permissionless chains generally, not unique to Robinhood Chain, and it argues for treating any individual token's early momentum as provisional rather than settled.
For builders, that points toward the market-structure fundamentals covered earlier in this report: liquidity depth, holder distribution, transparent communication, and genuine product adoption, rather than any single early metric.
For traders and investors, it argues for the same independent diligence outlined in the Token Market-Structure Review Checklist, applied consistently rather than selectively.
Readers evaluating activity on Robinhood Chain, whether as builders or as traders, should treat the historical patterns in this report as one input among several, alongside independent liquidity, contract, and holder-concentration analysis, and should not treat any figure or observed zone in this report as a guarantee or prediction of future performance.
Resources/Further-Reading
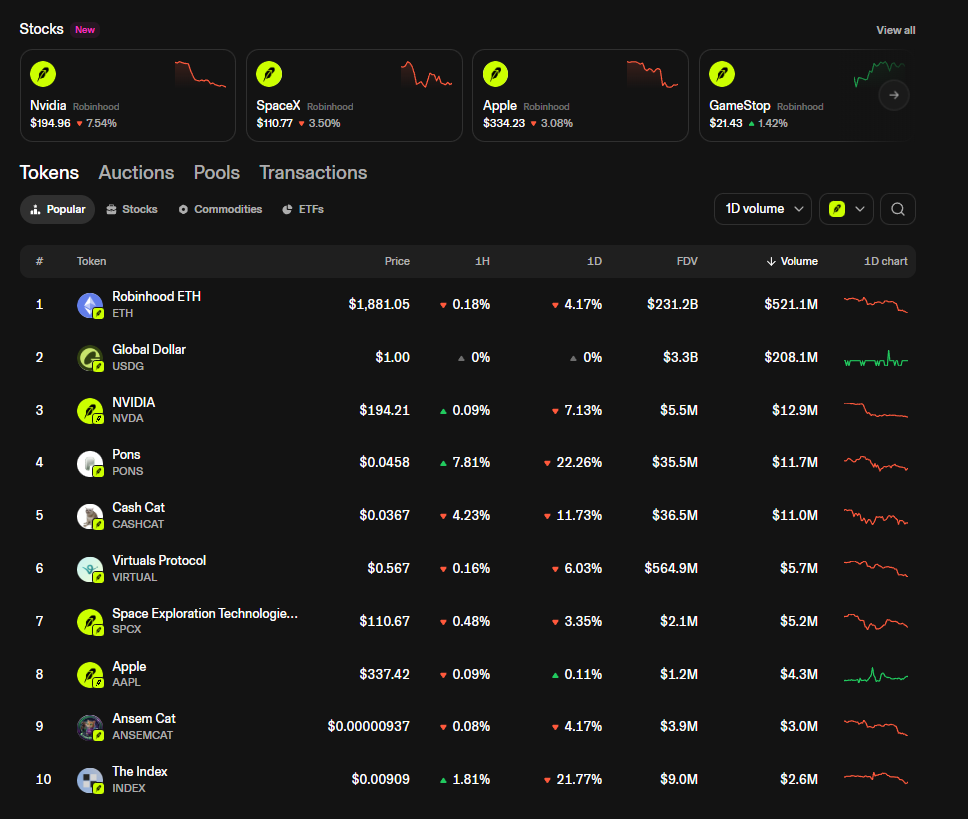
For a current view of tokenized assets trading on Robinhood Chain, including stock tokens, commodities, ETFs, and altcoins, see Uniswap's explore page at https://app.uniswap.org/explore/tokens/robinhood.
This is a live, third-party interface, not an official Robinhood or Trireme resource, and listings and rankings there can change quickly.
About This Report
This report was prepared by Trireme Trading, an institutional crypto market-making and advisory firm, drawing on the firm's research and content function. It reflects publicly available data as of the dates noted throughout and the author's analysis of that data. It is independent commentary, is not sponsored content, and is not produced, reviewed, or endorsed by Robinhood, Robinhood Chain, or any protocol named in it. This report does not describe or promote any Trireme service, and any figures relating to Trireme's business are outside its scope.
Important Notice
This article is provided solely for general informational and educational purposes and is intended primarily for professional, institutional and technically sophisticated readers. It does not constitute financial, investment, trading, legal, tax, regulatory or technical advice, investment research, a personal recommendation, or an invitation, inducement, advertisement, offer or solicitation to enter into any transaction or to engage Trireme or any other service provider.
Nothing in this article should be treated as a recommendation to buy, sell, hold, issue, launch, list, stake, lend, borrow, provide liquidity in or otherwise transact in any cryptoasset, token or financial instrument. References to market activity, prices, market-cap levels, returns, trading patterns, projects and strategies are historical or illustrative only and are not forecasts, price targets or trading signals.
Cryptoassets are highly speculative and involve a substantial risk of loss, including the possible loss of all capital committed. Readers must conduct their own independent research and obtain appropriate professional advice before making any financial, technical or commercial decision.
Full Legal and Regulatory Disclaimer
This article has been prepared and published by Trireme's research and content team using publicly available data and the methodology described above.
No Advice, Recommendation or Regulated Research
The information contained in this article is general in nature and has not been prepared by reference to the objectives, financial circumstances, experience, risk tolerance or needs of any particular person.
It does not constitute and should not be construed as:
- financial, investment, trading, legal, tax, accounting, regulatory, cybersecurity or other professional advice;
- investment research, independent research or a research recommendation;
- a representation that any asset, transaction, strategy, service or course of action is appropriate or suitable for any person;
- a recommendation or encouragement to purchase, sell, hold or otherwise transact in any cryptoasset, security, commodity, derivative or other financial instrument; or
- advice concerning the merits, timing, structure or likely profitability of any transaction.
Readers must conduct their own independent research and obtain advice from appropriately qualified professional advisers before taking any action.
No Offer, Invitation, Inducement or Solicitation
Nothing in this article constitutes or forms part of an offer, invitation, inducement, advertisement, promotion, recommendation or solicitation to:
- issue, purchase, subscribe for, sell, hold, trade, stake, lend, borrow or otherwise transact in any cryptoasset, token, security, commodity, derivative, financial instrument or investment product;
- launch, list, distribute or provide liquidity in relation to any token or cryptoasset;
- participate in any investment, financing, token issuance, liquidity arrangement, trading strategy or other transaction; or
- engage Trireme or any third party to provide market-making, liquidity, execution, dealing, brokerage, investment advisory, portfolio-management, placement, capital-raising, token-launch, listing or other services.
Any descriptions of Trireme's experience, activities or capabilities are provided solely as general corporate background. Trireme's services are not offered through this article. No advisory, client, fiduciary or other professional relationship is created by accessing, receiving or relying upon this article.
Any potential engagement with Trireme would be subject to separate direct discussions, applicable client-classification and eligibility requirements, KYC, AML and sanctions screening, conflicts checks, regulatory and legal assessment, internal acceptance procedures and a definitive written agreement.
Jurisdictional Restrictions
This article is not directed at retail consumers and is not intended for distribution to or use by any person or entity in any jurisdiction where such distribution, communication or use would be contrary to applicable law or would require Trireme or any other person to be authorised, registered, licensed or approved.
In particular:
United Kingdom: This report is intended as general, independent market commentary and is not intended to constitute an invitation or inducement to engage in investment activity or to promote any Trireme service. Cryptoassets are high-risk and readers may lose all capital committed. Publication, distribution and use of this report remain subject to applicable UK law.
European Economic Area: This article is not an offer to the public, a cryptoasset white paper, a marketing communication concerning an offer of cryptoassets, or an invitation to receive a regulated cryptoasset service. It is not directed at EEA retail clients.
United States: This article does not constitute an offer to sell or solicitation of an offer to purchase any security, commodity interest, derivative or other regulated financial product in the United States. Nothing in it constitutes brokerage, dealing, investment-advisory or commodity-trading-advisory services.
Asia-Pacific: This article is not directed at members of the public in Singapore, Hong Kong, Japan or any other Asia-Pacific jurisdiction in which publication, active marketing or the provision of digital-asset services would require authorisation, registration or licensing. No regulated service is offered or actively marketed to any such person through this article.
Access to this article does not establish that any Trireme service is available or lawful in the reader's jurisdiction. Each reader is responsible for obtaining independent local legal advice and complying with all laws applicable to them.
Market Information and Forward-Looking Statements
All references to token prices, market cap, liquidity, volume, wallet activity, profitability, historical returns, trading behaviour, technical levels, launch timing or market performance are historical or illustrative observations only.
They are not:
- forecasts or guarantees of future performance;
- price targets;
- buy, sell or hold recommendations;
- representations that an identified pattern will recur; or
- indications that any project, token, protocol or strategy will be successful.
Past performance and historical market patterns are not reliable indicators of future results. Statements regarding possible future developments, adoption, market activity, liquidity or performance are inherently uncertain and may not materialise.
Data Accuracy
Information may have been obtained from public blockchains, analytics platforms, protocols, project materials and other third-party sources. Although Trireme may consider such sources relevant, the information may be delayed, incomplete, inaccurate, misclassified, subject to manipulation or subsequently revised.
Unless expressly stated otherwise, the information has not been independently audited or verified. Trireme makes no representation or warranty, express or implied, regarding its accuracy, completeness, timeliness or continued availability and has no obligation to update it.
Cryptoasset and Technology Risks
Cryptoassets, decentralised-finance protocols and related technologies are speculative and involve substantial risks, including:
- complete loss of capital;
- extreme price volatility and illiquidity;
- market manipulation, wash trading, fraud and misleading disclosures;
- smart-contract vulnerabilities and coding errors;
- bridge, oracle, validator and infrastructure failures;
- cyberattacks, compromised wallets and loss of private keys;
- custody, counterparty and exchange insolvency risk;
- regulatory intervention or changes in law;
- taxation and reporting consequences; and
- the absence of deposit insurance, investor-compensation arrangements or effective legal recourse.
Technical examples, code, deployment instructions and security observations are illustrative only and should not be used in a production environment without independent testing, audit and specialist technical review.
Third-Party References
References to Robinhood, Robinhood Chain, exchanges, protocols, launchpads, tokens, analytics providers or other third parties do not constitute an endorsement, recommendation, partnership, sponsorship or affiliation unless expressly confirmed in a separate official written announcement.
All names, logos and trademarks remain the property of their respective owners.
No Warranty and Limitation of Liability
To the fullest extent permitted by applicable law, Trireme and its affiliates, officers, employees, contractors and representatives disclaim all liability arising from or connected with the use of, or reliance upon, this article, including any direct, indirect, consequential, trading, investment, technical, commercial or other loss.
Nothing in this disclaimer excludes or limits liability that cannot lawfully be excluded, including liability arising from fraud or fraudulent misrepresentation.
Sources and Methodology
- Robinhood official newsroom: robinhood.com/us/en/newsroom/robinhood-accelerates-global-expansion-robinhood-chain-mainnet-stock-tokens-agentic-trading
- Robinhood Chain developer docs: docs.robinhood.com/chain/connecting
- Robinhood Chain Crypto X Account
- Uniswap launch announcement: blog.uniswap.org/robinhood-chain-is-live
- Chain-level TVL, RWA market capitalisation, stablecoin market capitalisation, DEX volume: DefiLlama — Robinhood Chain, dune.com/geggonen/robinhood-chain-analytics
- Individual token charts: Dexscreener, per-pair links cited under each token above.
- Trireme Research team