The February 2026 Playbook Across Crypto, Equities, and Macro
January flushed excess leverage, exposed crowded narratives, and forced capital to rotate.
February is where markets begin to reveal what actually deserves capital in Q1.
Below is a clean, cross-asset breakdown of what matters now, based on macro signals, price behavior, and social market attention.
The Hawkish Pivot
The central conflict in the current market is the end of “easy money.”
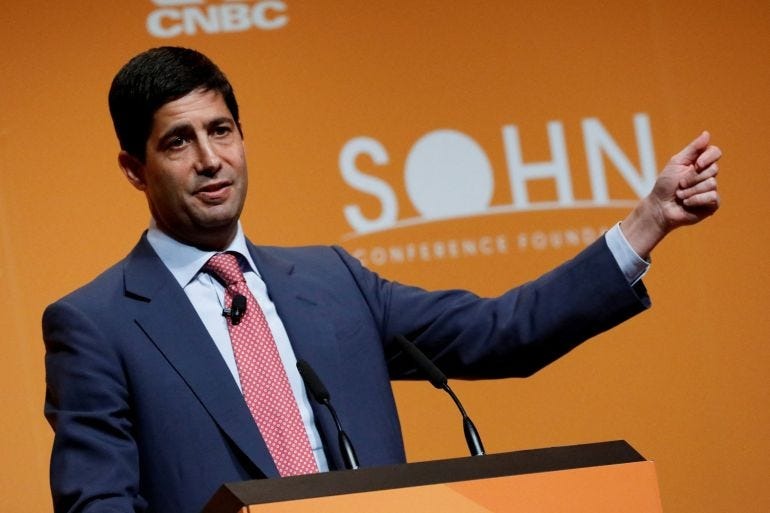
- The Warsh Era: The confirmation of Kevin Warsh as the Fed Chair has shifted market expectations. Unlike previous “Dovish” regimes, a Warsh-led Fed signals “Higher for Longer” interest rates.
- Asset Competition: With US Treasury yields remaining high, Bitcoin and Ethereum are no longer competing against 0% cash; they are competing against a 5% guaranteed return. This requires crypto assets to prove “Real World Value” (RWAs) rather than just speculative potential.
- Risk-Off Cascades: The transition from a “Dovish” expectation to a “Hawkish” reality recently triggered a $2.5 billion liquidation eve event, dragging BTC from the $100k+ range down toward the mid-$70k level.
Equities are making headlines for new highs, but the details matter.
1. Labor Market Looks Strong on the Surface, Fragility Building Underneath
Initial jobless claims remain low, which keeps the headline narrative “resilient labor market” intact.
However, forward-looking data tells a more fragile story.
- ADP employment growth is below the median level seen since 2004, a zone historically observed ahead of major slowdowns such as 2008 and Covid.
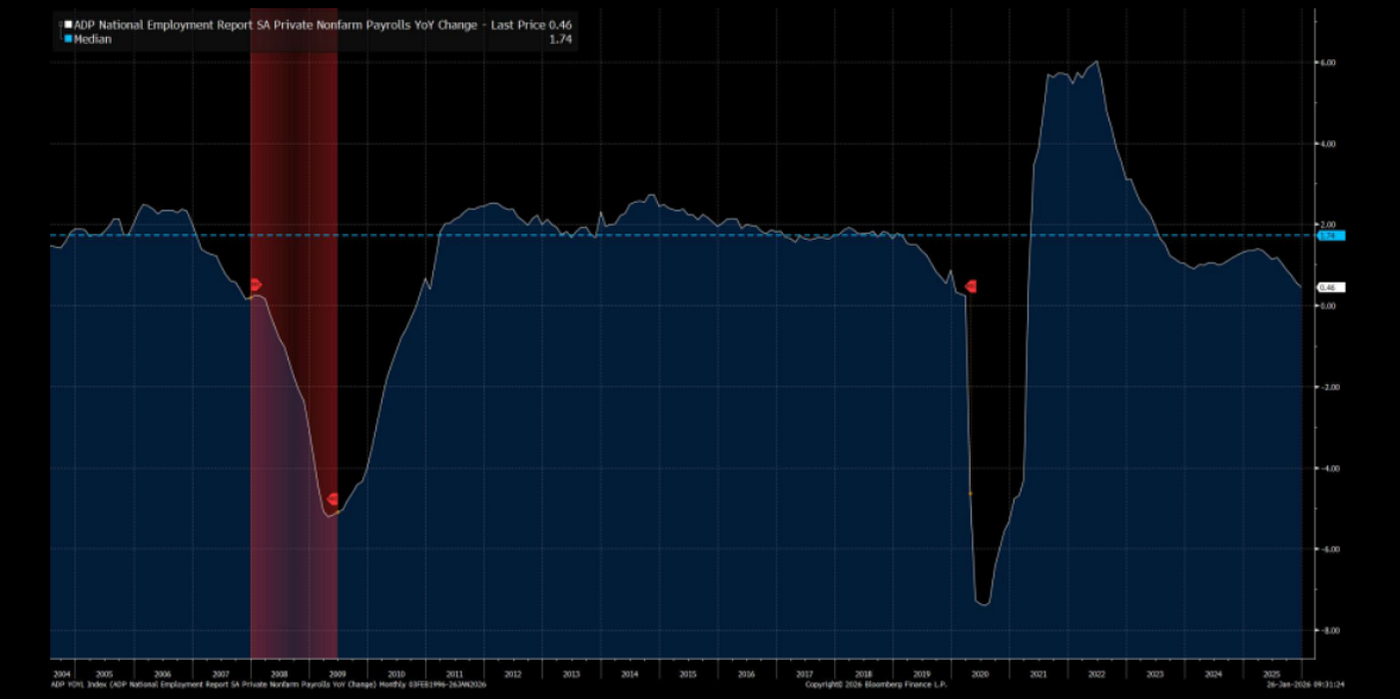
- This week’s ADP, JOLTS, and NFP are coin-flip events that can rapidly shift rate expectations.
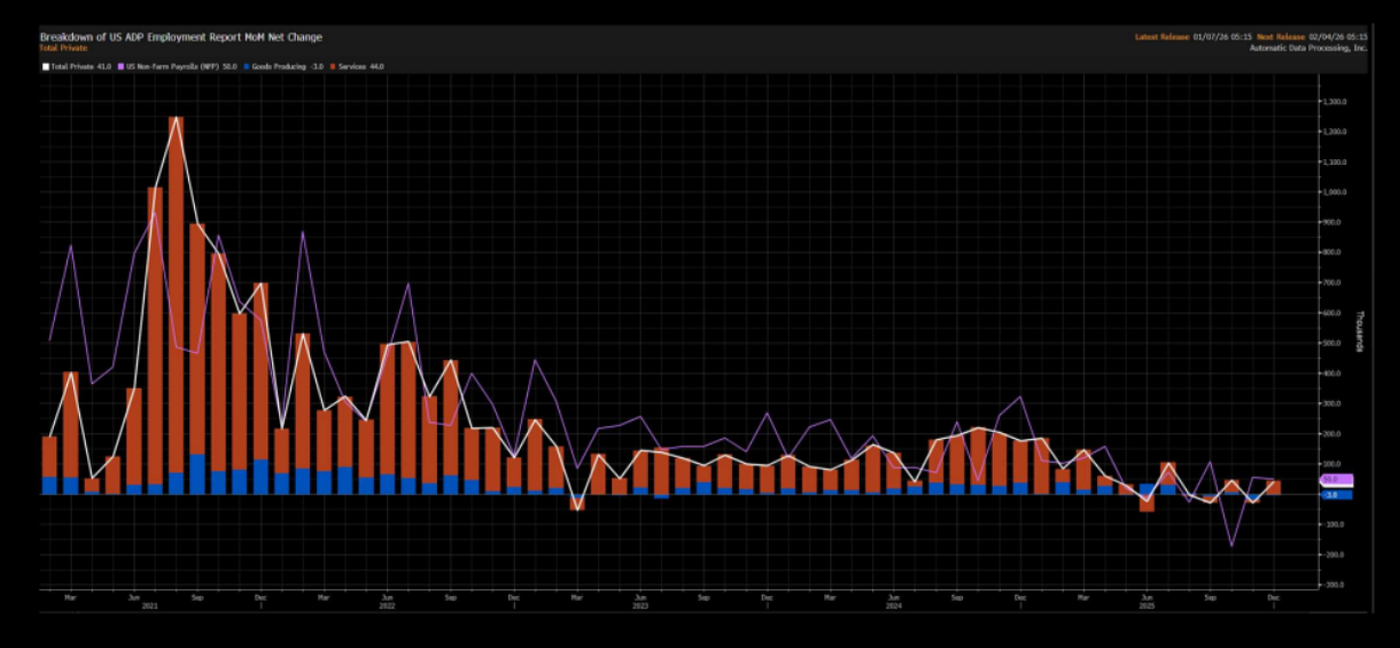
- A gradual cooling supports a soft-landing narrative. A sharper slowdown risks recession pricing.
Why it matters:
Labor data will directly influence inflation expectations and the timing of any Fed pivot, which remains the single biggest driver for crypto and equities.
2. Real Rates Are the Core Variable for Risk Assets
The key macro driver remains real rates, defined by the gap between policy rates and inflation expectations.
- Rising inflation expectations with stable rates → real rates fall → supportive for equities and crypto.
- Falling inflation expectations with high rates → real rates rise → pressure on valuations and liquidity.
This dynamic explains why:
- 2022’s shift to positive real rates triggered a major BTC and risk-asset drawdown.
- Current markets are hypersensitive to CPI, wage data, and Fed communication.
Why it matters:
Crypto does not need rate cuts immediately. It needs real rates to stop rising.
3. Equities at All-Time Highs, But Volatility Is No Longer Suppressed
The S&P 500 made new highs, but with a key change in market structure:
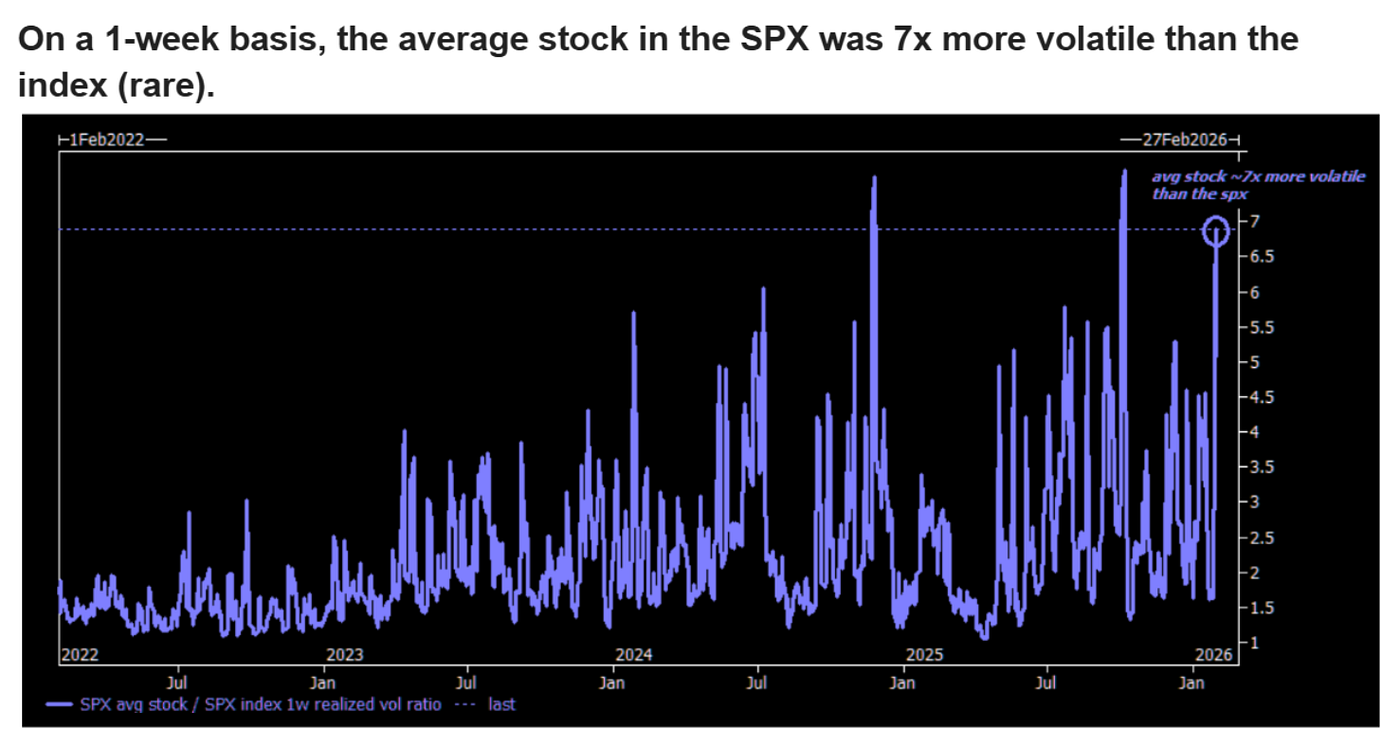
- The average stock is now ~7x more volatile than the index, a rare condition.
- VIX is holding above 16, signaling higher hedging costs and increased sensitivity to surprises.
This marks a transition:
- From broad index-driven rallies
- To selective, rotation-heavy markets beneath the surface
Why it matters:
Late-cycle behavior favors stock pickers, sector rotation, and tactical positioning rather than passive exposure.
4. Geopolitical Risk Raises Volatility, Not Structural Bear Markets
Historical analysis shows an imperfect relationship between geopolitical shocks and equity crashes.
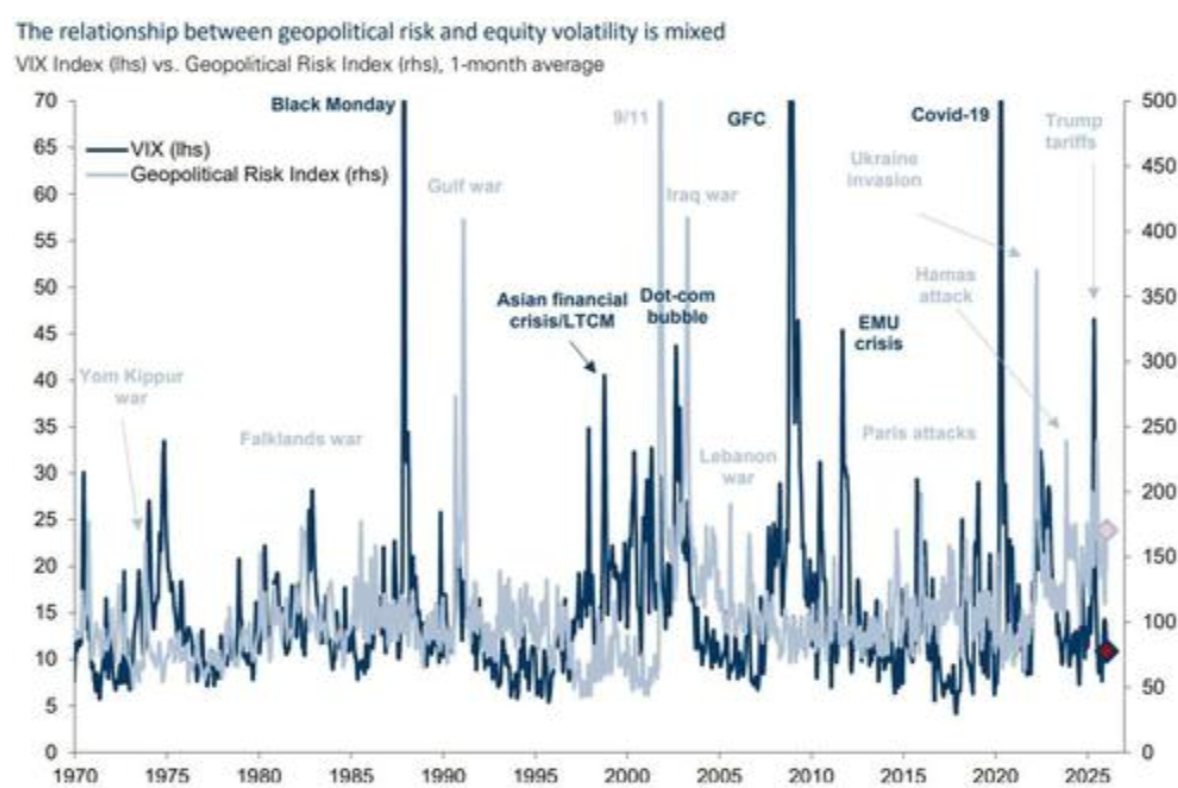
- Geopolitical risk rarely pushes the VIX above 40 on its own.
- Equities have historically recovered and moved higher after most geopolitical shocks.
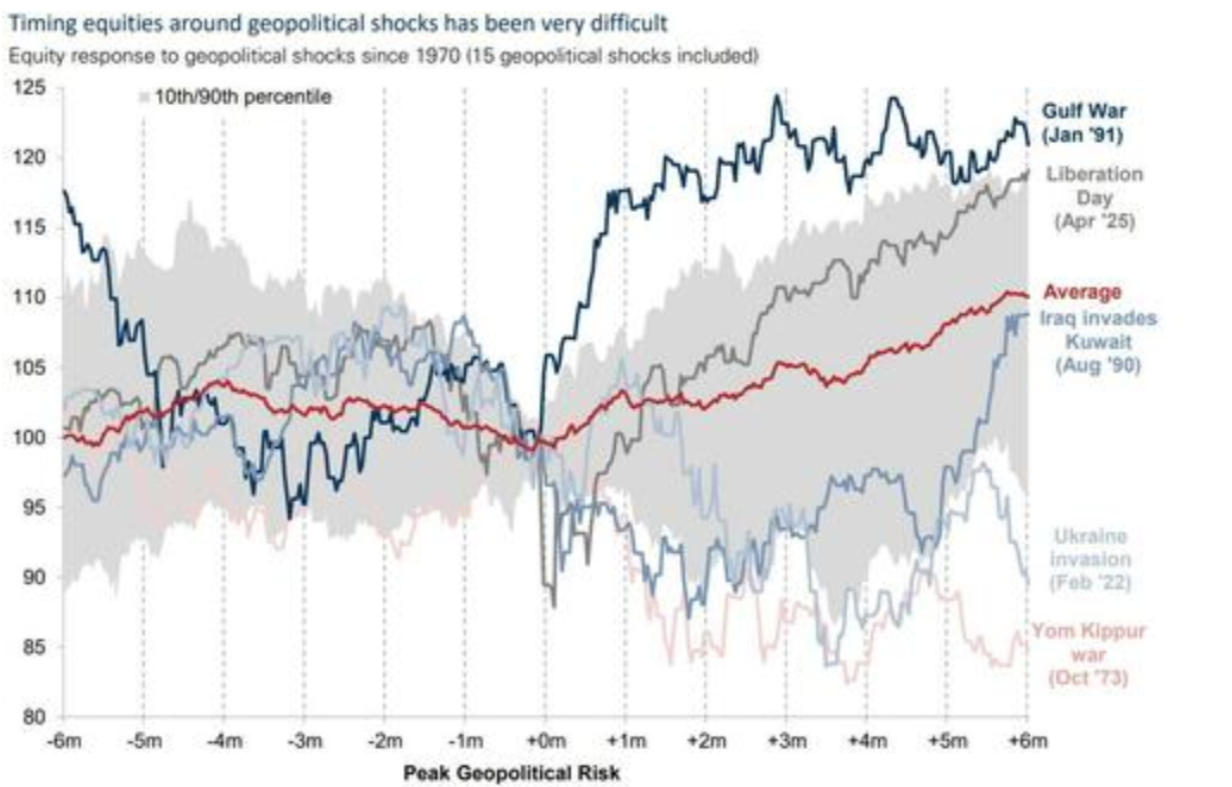
Current tensions raise volatility but are not enough, by themselves, to end the cycle.
Markets are entering February with:
- Elevated equity prices
- Rising volatility
- Heavy dependence on macro data surprises
Top Crypto Topics Dominating Social Media and Market Feeds
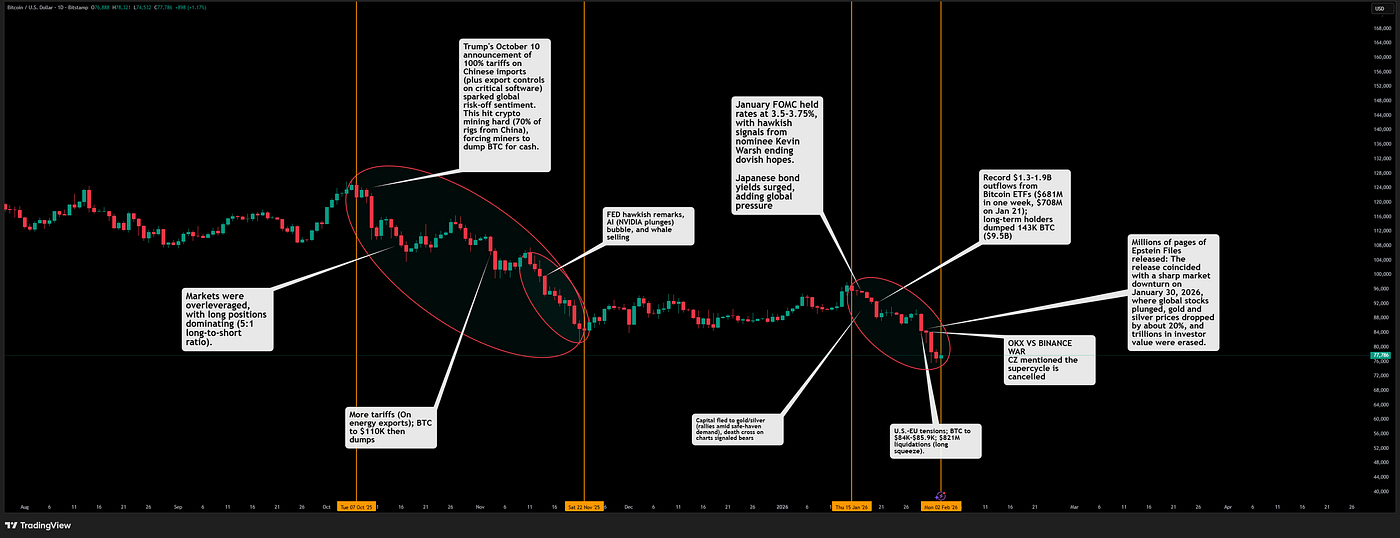
1. Bitcoin and the Crypto market dump timeline:
Bitcoin has dropped to its lowest levels since 2024, sparking intense debate among top crypto creators about whether this move marks a bottom or the start of a deeper bear phase.
2. Trending on Coinmarketcap: What is the best bear market strategy?

- Influencers frames the selloff as long-term holder distribution rather than panic, highlighting 85K and 80K as the key liquidity levels.
- Some are calling the move a late-cycle pressure but stressing that $BTC structure only turns bearish if it falls below 70k.
- Key market analysts warns that losing 70K on a daily close could open door to a faster downside.
- Fundamentals are also not breaking, but the thin liquidity and leverage made this move violent.
3. Timeline of Major Crypto Market Dumps and key events from January 29 to February 2, 2026
January 29:
Fed holds rates at 3.5%–3.75%. Risk-off sentiment intensifies amid geopolitical tensions (U.S.–Europe Greenland dispute, Iran threats). Bitcoin drops to $84,000 (lowest in 2026, down 5–6%). ETH and DOGE fall up to 6%. CoinDesk 20 index down 2.9%. $650M+ liquidations. Tech stocks like Microsoft sell off, amplifying risk-off.
January 30:
Bitcoin plunges to $81,000 (9-month low). $1.7B liquidations, 182,000 traders wiped out. U.S. dollar weakens after Treasury “yen rate check,” pressuring risk assets. Market cap sheds $2.9T in a day. Trump threatens 100% tariffs on Canada and potential strikes on Iran.
January 31:
Bitcoin breaks below $80,000 amid $1T wipeout fears. Trump nominates hawkish Kevin Warsh as Fed Chair; odds surge. Persistent ETF outflows and tariff threats (25–60% on autos) fuel panic. Total market cap dips below $3T.
February 1:
Crash intensifies. Bitcoin to $75,700–$79,000 (down 10%+). $2B liquidations, including a $222M ETH position. SOL down 15% YTD. Broad altcoin bleed (SAND, FLOW, AXS down 8–25%). U.S. Treasury sanctions Iran-linked exchanges.
February 2:
Bitcoin stabilizes around $78,700 (down 10.1% from Jan end). Total market cap $3.1T after $2.9T wiped. Liquidations and bearish sentiment persist; BTC shows potential two-month bear market signals on-chain.
4. Trending Altcoins
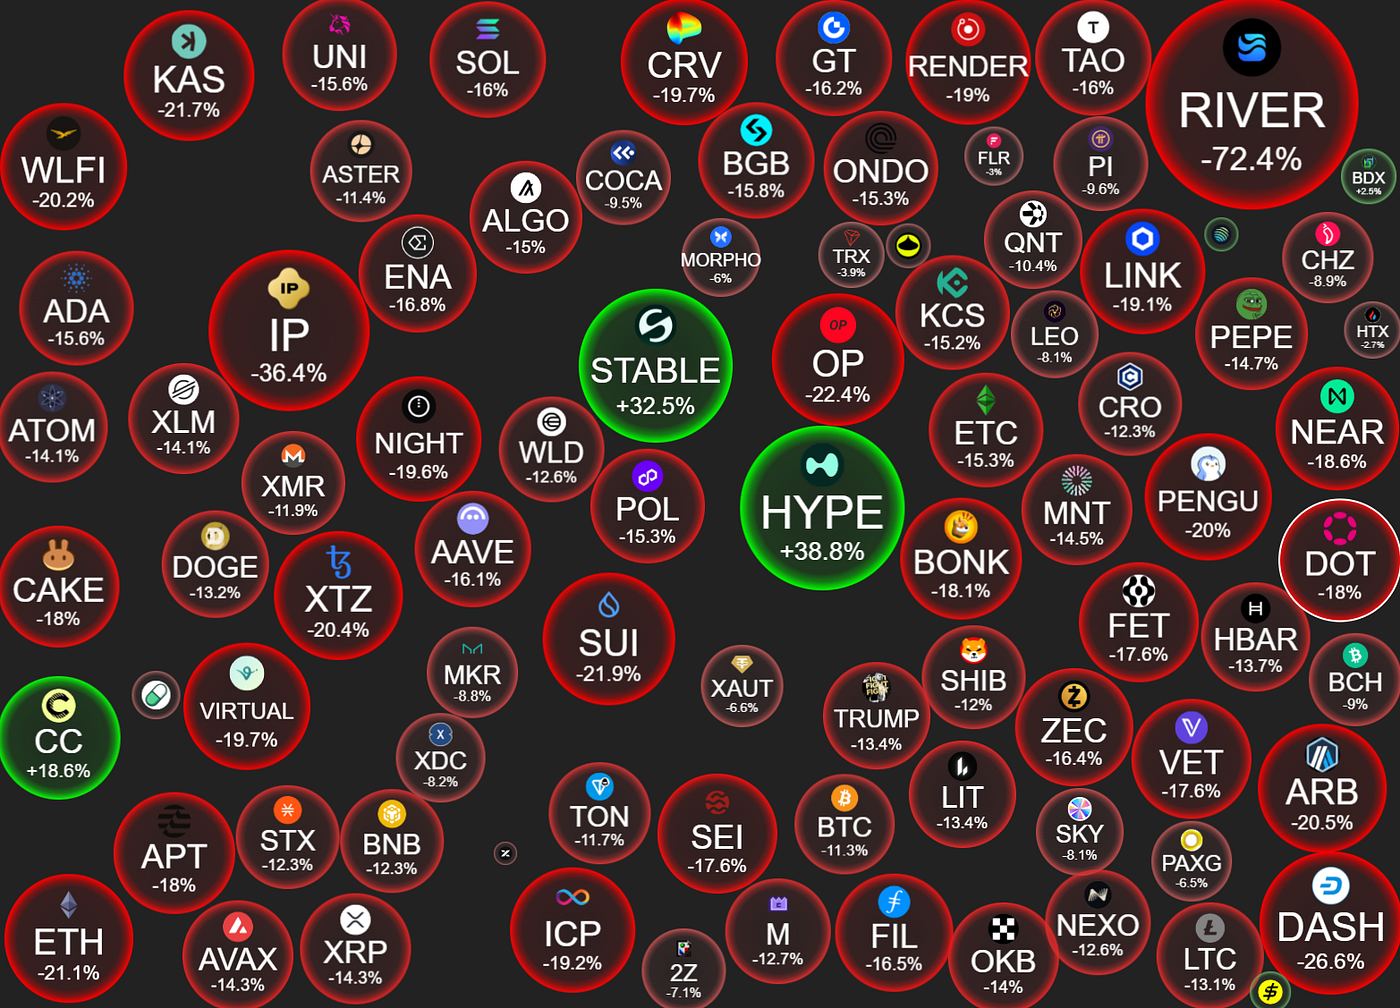
Check the trending altcoins here: https://cryptobubbles.net/
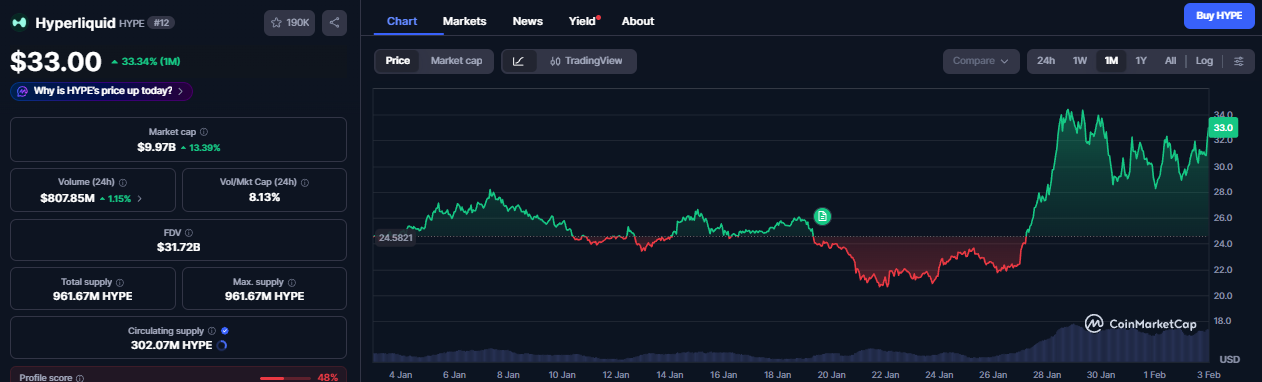
- $HYPE — Strong in Perp DEX volume and open interest growth
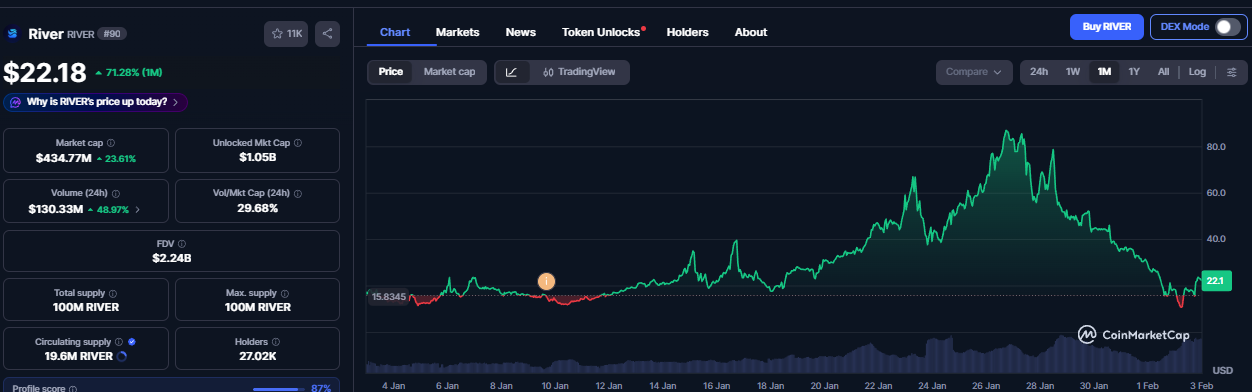
- $RIVER — Massive recent surge (e.g., +198% in prior week reports, new ATHs around $80+) and then dumping hard
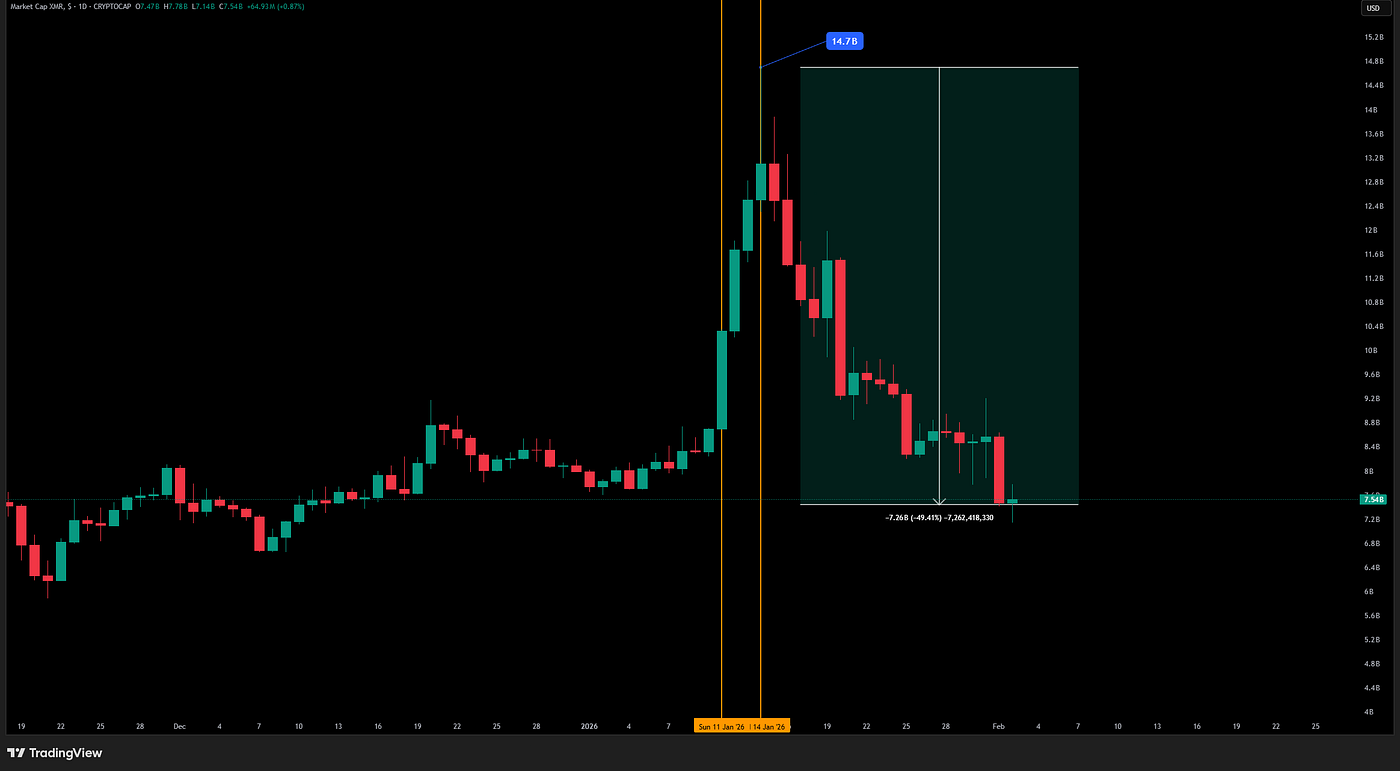
- $XMR — Privacy narrative x strong momentum narrative
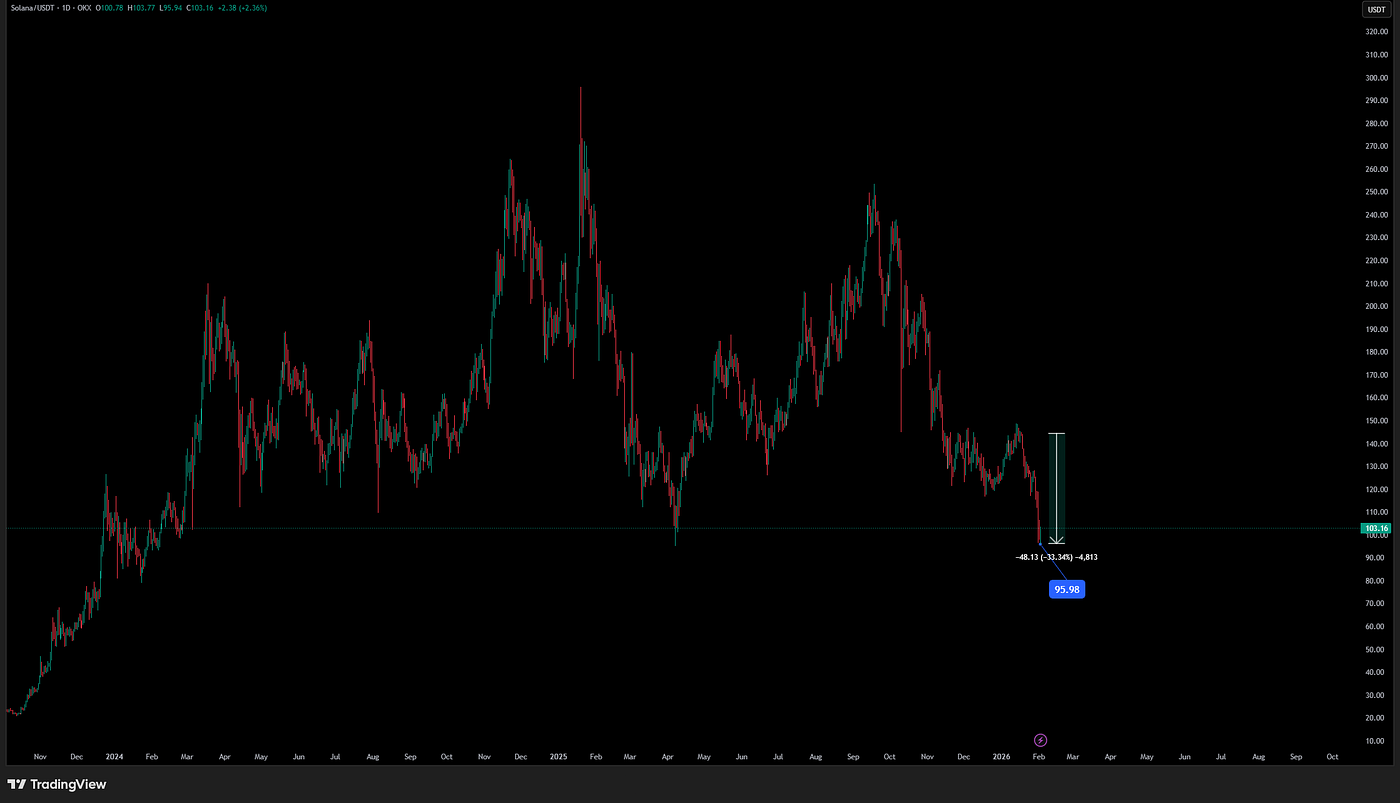
- $SOL went down below $100 for the first time since April 2025
Closing Perspective
What unfolded from late January into early February was not a random crash.
It was a coordinated macro reset driven by policy uncertainty, geopolitical leverage, crowded positioning, and structural fragility across leverage-heavy markets.
Capital rotated exactly as history suggests it would:
- From high beta crypto into gold, silver, and equities at first
- Then out of overextended safe havens once profit-taking peaked
- Leaving crypto to absorb forced liquidations, ETF outflows, and sentiment-driven selling
At the same time, smart money behavior diverged sharply from retail.
Whales, OTC desks, and long-horizon institutions accumulated into weakness while headlines amplified fear.
How Trireme Helps in This Environment
Trireme exists for moments exactly like this.
We help founders, funds, and market participants navigate capital rotation cycles by focusing on structure, liquidity, and positioning, not headlines.
What Trireme provides:
- Macro-aligned market intelligence that connects crypto, equities, rates, and commodities
- Liquidity and positioning insights during drawdowns, not just expansions
- Clear read-throughs on where capital is rotating next and why
- Signal filtering across social media, onchain flows, derivatives, and macro policy
- Strategic guidance for operating through volatility rather than reacting to it
As crypto exchanges evolve into global markets for everything and tokenized assets blur the line between TradFi and DeFi, understanding where capital can move becomes more important than chasing narratives.
Trireme helps you stay positioned before the rotation
Follow real-time commentary and positioning insights on X: @TriremeTrading